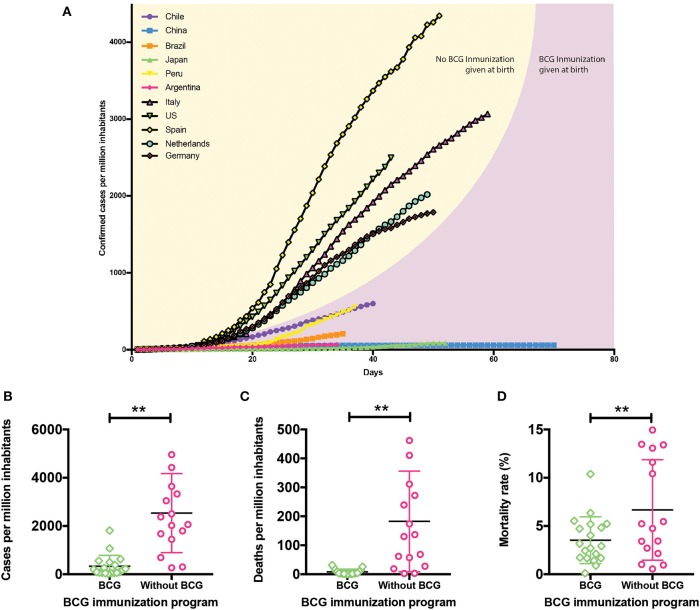
Figure 2.
Protective role of BCG in SARS-CoV-2 infection. (A) Confirmed cases of COVID-19 since the day they exceeded 2 cases per million up to date. Country curves with a black line and yellow background correspond to those without BCG vaccination program. Country curves with a pink background correspond to those where BCG vaccination is administered at birth. (B) Confirmed cases of COVID-19 per million inhabitants, (C) deaths per million inhabitants, and (D) mortality rates in countries with or without BCG vaccination schedule. Statistical Method: Each group represents the mean ± SD (error bars) of the responses in populations vaccinated (22 countries) and unvaccinated (16 countries) with BCG. Data were compared by t-test with a confidence interval of 95% to discriminate statistically significant differences between groups (**), we determine that variances are equals, contrasted by F test (P < 0.05). To see updated data, please follow the following link http://www.imii.cl/en/confirmed-covid-19-cases-per-million-inhabitants/ (Source: Center for Systems Science and Engineering, CSSE, Johns Hopkins University, Accessed on April 22, 2020; World Health Organization, WHO).

