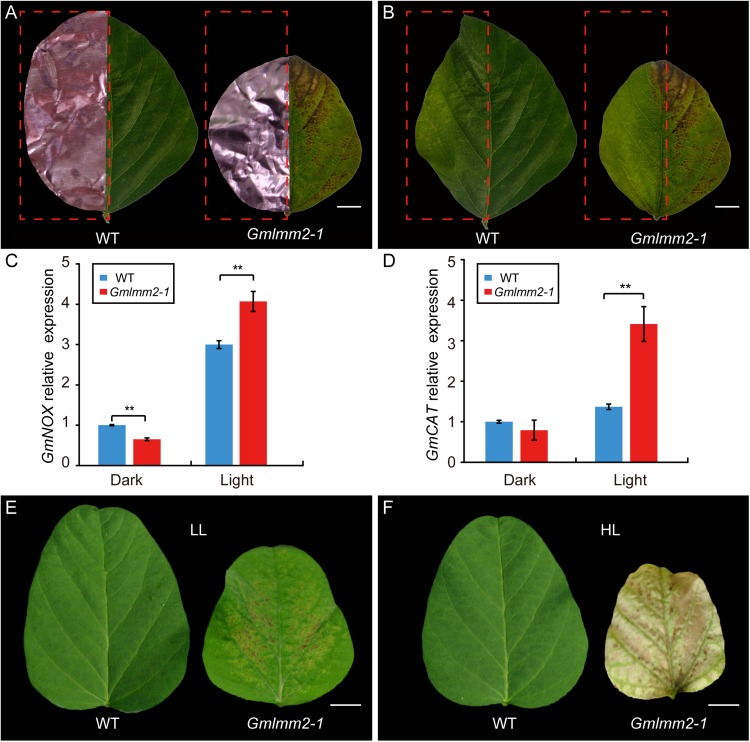
FIGURE 5.
Light avoidance assay in leaves of “Williams 82” and the Gmlmm2-1 mutant before (A) and after (B) removing the shading foils. Scale bars = 0.5 cm. Comparison of expression levels of GmNOX (C) and GmCAT (D) between shaded (Dark) and un-shaded (Light) half leaflet. Phenotype of leaf growing under (E) lower intensity light (LL) and (F) high intensity light (HL). Scale bars = 1 cm. Asterisks’ indications are same as Figure 1.

