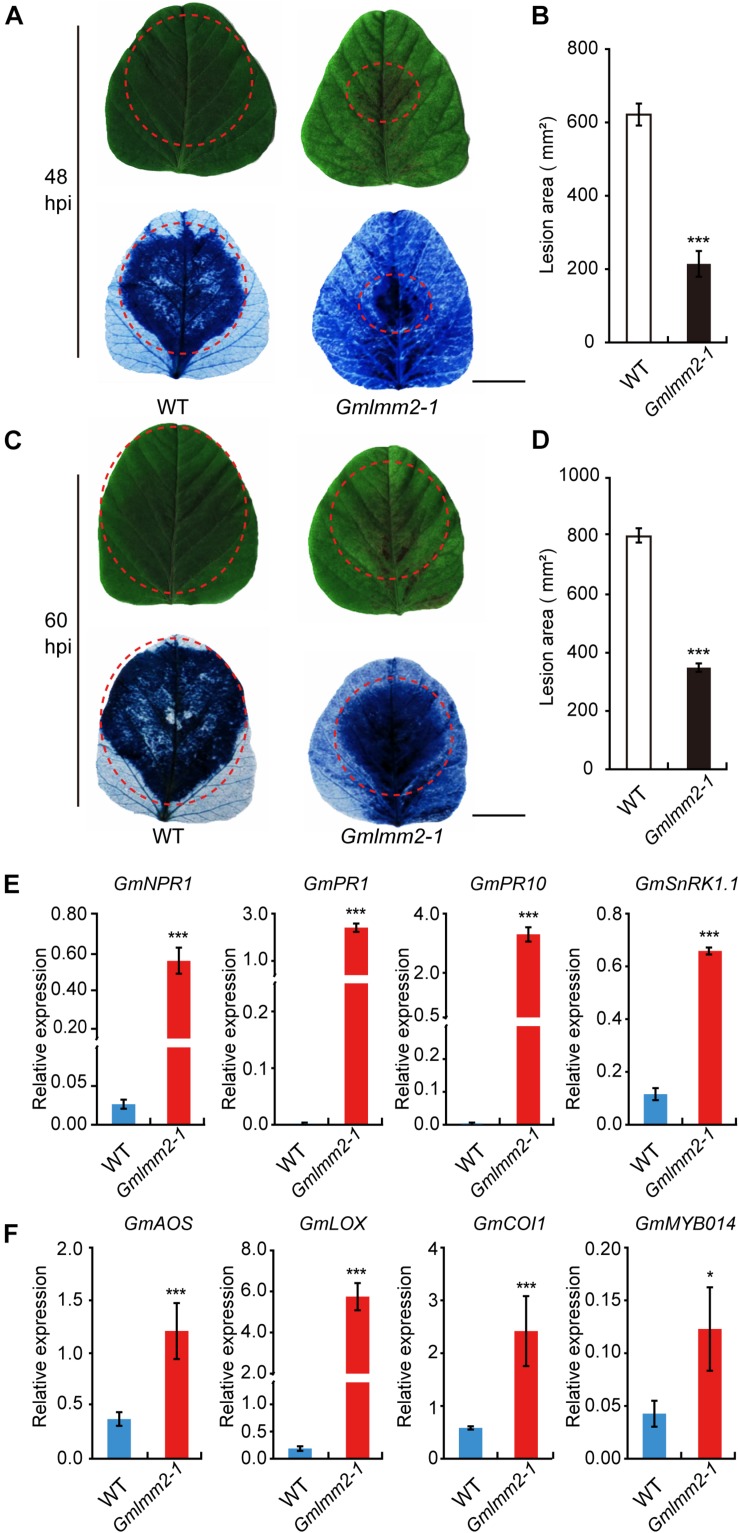
FIGURE 6.
Up-regulation of resistance-related genes and enhanced pathogen resistance. (A–D) The infection phenotypes of “Williams82” (WT) and the Gmlmm2-1 mutant at 48 and 60 hpi with Phytophthora sojae stain P7076. Trypan blue staining demonstrated that infection levels were similar to those of the leaves shown above. Scale bars = 1 cm. The sizes of the lesions were statistically analyzed corresponding to (A–C). (E,F) The expression levels of SA-signaling and JA-signaling genes in “Williams82” (WT) and the Gmlmm2-1 mutant. The data shown are the mean values of three biological replicates and the error bars represent the standard deviation (SD). Data are presented as fold difference from the WT control after normalizing to the control gene GmActin11. Relative expression levels are presented as means ± SD. Data are from three biological replicates. *P < 0.05, **P < 0.01, ***P < 0.001 (t-test).

