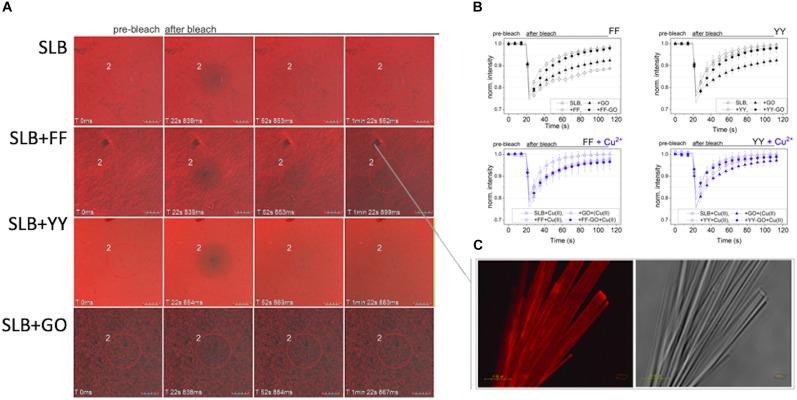
FIGURE 6.
Representative confocal micrographs ((A), scale bar = 10 μm) and intensity curves (B) for the FRAP experiment of rhodamine-labeled (in red) SLBs, both untreated and after 15 min of exposure to the peptide-GO samples assembled in the absence (black) or the presence (blue) of CuSO4 (triangle = bare SLB; circles = treated SLBs; open symbols = free dipeptides; solid symbols = GO-driven assemblies). (C) A confocal (left hand side) and optical bright field (right hand side) micrograph of FF nanotubes after the interaction with rhodamine-labeled lipids; scale bar = 4 μm.

