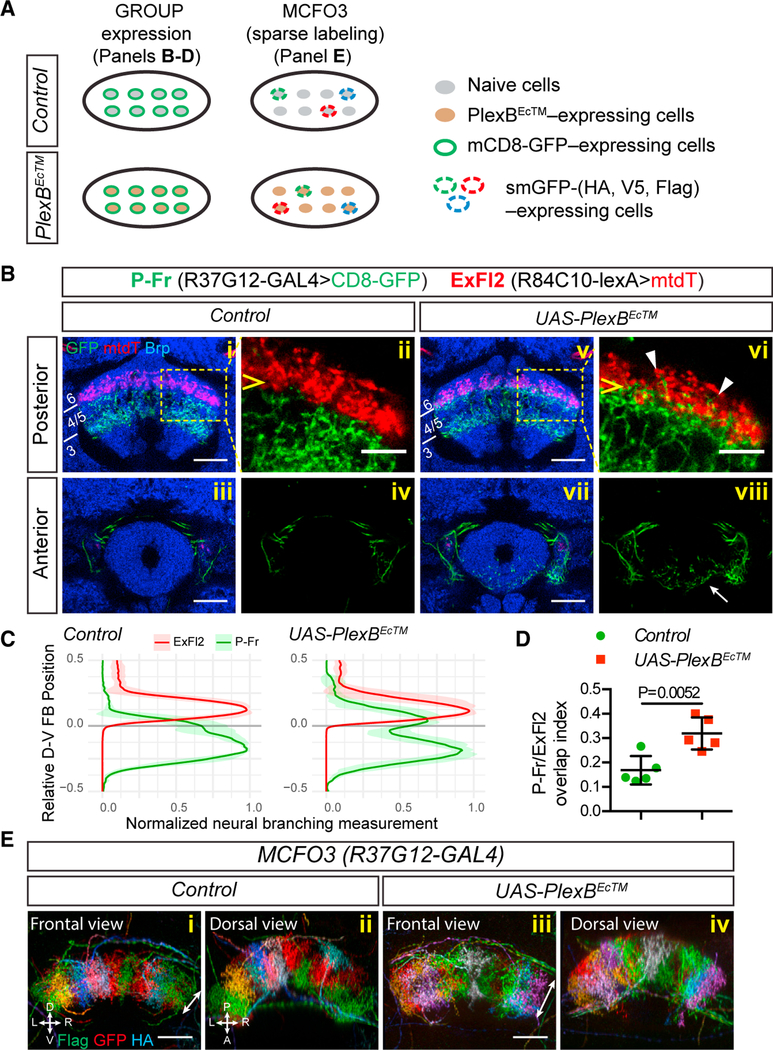
Figure 3. Plexin B Is Required for P-Fr Neuron-Process Lamination.
(A) Schematics showing two different approaches used to express reporter genes in neurons belonging to a single group (“GROUP”) or a subset of neurons within that group (“MCFO”). Lower diagrams show that PlexBEcTM (a dominant-negative truncated PlexB receptor) is mis-expressed in the entire group of P-Fr neurons in both cases. smGFP = spaghetti monster GFP.
(B) P-Fr and ExFl2 neurons were labeled with R37G12-GAL4 driving mCD8-GFP expression and R84C10-lexA driving mtdT expression, respectively. CadN staining (blue) labels adult brain structures. In control animals (i–iv), P-Fr processes (green) and ExFl2 axons (red) are located in different FB layers (P-Fr in layers 3–5 and ExFl2 in layer 6) (i–ii). When PlexBEcTM is expressed in P-Fr neurons (v–viii), their processes extend into FB layer 6 (posterior section, arrowheads in vi) and also mis-project into the EB (anterior section, arrow in viii).
(C) Quantification of P-Fr and ExFl2 process distributions along the dorsal-ventral (D-V) axis in the FB. We measured P-Fr branches at specific D-V positions by counting numbers of voxels that had GFP or mtdT labeling intensities above the chosen thresholds; these values were then normalized to the largest value for each individual brain (X axis). We aligned the lower boundary of ExFl2 axon staining and set it as position 0 and we calculated the relative D-V position by normalizing the absolute distance between each D-V position and position 0 to the total D-V extent of the FB (Y axis). There is expansion of P-Fr processes (green line) into layer 6 (above position 0).
(D) The Overlap index of P-Fr processes with ExFl2 axons is defined by the sum of P-Fr branch measurements above position 0 divided by total measurements across all D-V positions (see Star Methods for additional quantification details; t test was performed for this comparison; n = 5 brains for each genotype).
(E) R37G12-GAL4 and MCFO3 transgenes were combined so that individual P-Fr neurons were labeled in multiple colors. Note that processes from individual P-Fr neurons occupy individual columns orthogonal to the plane of FB lamanae across the total extent of the FB. When PlexBEcTM is expressed in all P-Fr neurons, their processes extend ectopically along the D-V axis (double-headed arrows); this is similar to what we observe with only mCD8-GFP labeling (B). The columnar organization of these processes appears largely intact despite PlexBEcTM expression.
All scale bars represent 20 μm.

