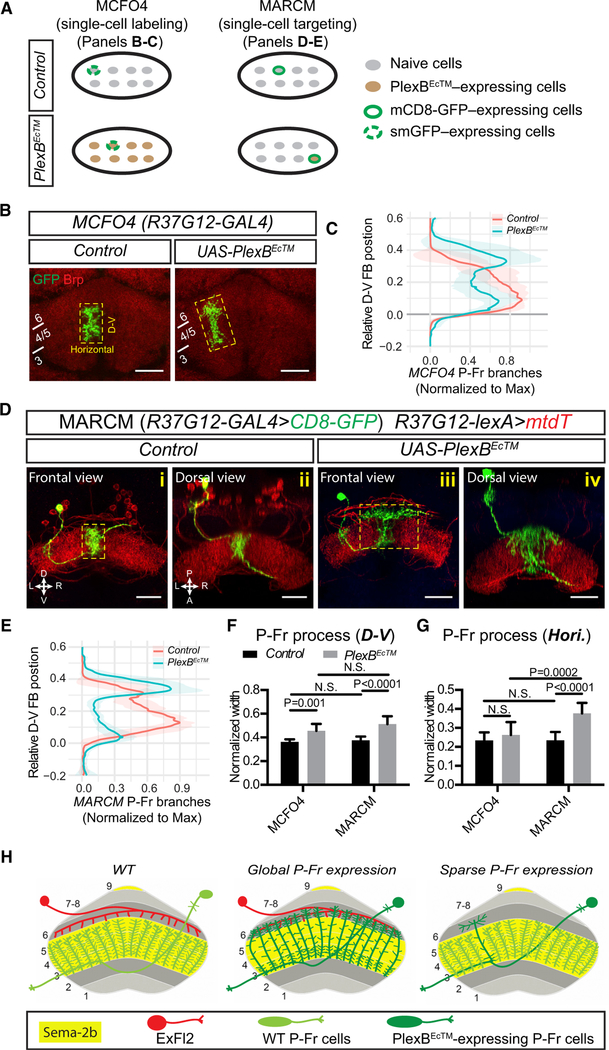
Figure 4. Cell-Autonomous Requirement for PlexB in P-Fr Process Lamination.
(A) Schematics showing two different approachesused here for expressing reporter genes in an individual neuron within a group. Lower diagrams show that PlexBECTM is expressed in the entire group of P-Fr neurons when MCFO4 labeling is used, but it is expressed in a single P-Fr neuron that expresses the reporter gene when MARCM (mosaic analysis with a repressible cell marker) is used.
(B) The MCFO4 fly line, which expresses a less robust flipase (FLP) than does the MCFO3 line, was used for labeling single P-Fr neurons (green). The FB is illuminated with anti-Brp staining (red). When PlexBEcTM is expressed in all P-Fr neurons, GFP-labeled single P-Fr neuron processes exhibit a dorsal expansion but also express preservation of their columnar organization.
(C) Quantification of the normalized distributionof MCFO4-labeled P-Fr neuron processes along the D-V axis in control and PlexBEcTM- expressing conditions. P-Fr processes are measured as in Figure 1C except that only GFP labeling is quantified and the ventral boundary of each P-Fr process is aligned and set to position 0. Note the dorsal shift of P-Fr process extension when PlexBEcTM is overexpressed in all P-Fr neurons. n = 10 brains for each genotype.
(D) MARCM is used for expressing mCD8-GFP and PlexBEcTM in single P-Fr neurons under the control of the R37G12-GAL4 driver; all P-Fr neurons are simultaneously labeled by R37G12-lexA driving mtdT. In control animals, single CD8-GFP-labeled P-Fr neurons elaborate processes within a single column in FB layers 3–5; this is similar to other mtdT-expressing P-Fr neurons ([i] and [ii]). When PlexBEcTM was expressed in single P-Fr neurons, their processes ectopically innervated FB layer 6; they extended dorsally beyond other P-Fr neurons and expanded laterally to cover an area in layer 6 that was larger than their normal lateral columnar extent in more ventral layers ([iii] and [iv]).
(E) Quantification of the normalized distribution of MARCM-labeled P-Fr neuron processes along the D-V axis, as in (C). Note that P-Fr processes have relatively more branches in the dorsal FB than in the ventral FB following PlexBEcTM expression.
(F and G) Comparisons of P-Fr process width (normalized to FB width) along the D-V or lateral axes, as shown in the yellow boxes in B and D, respectively. n = 10 neurons for both MCFO4 control and MCFO4 PlexBEcTM; n = 8 neurons for MARCM control and 11 neurons for MARCM PlexBEcTM. Two-way ANOVA with multiple comparisons was used for (F) and (G).
(H) Schematics summarizing phenotypes exhibited by P-Fr neurons in the experimental conditions presented in this figure and in Figure 1. The cell bodies, and also the axonal and dendritic trajectories, of all P-Fr neurons are not shown in each diagram, with the exception of one P-Fr neuron.
All scale bars represent 20 μm.

