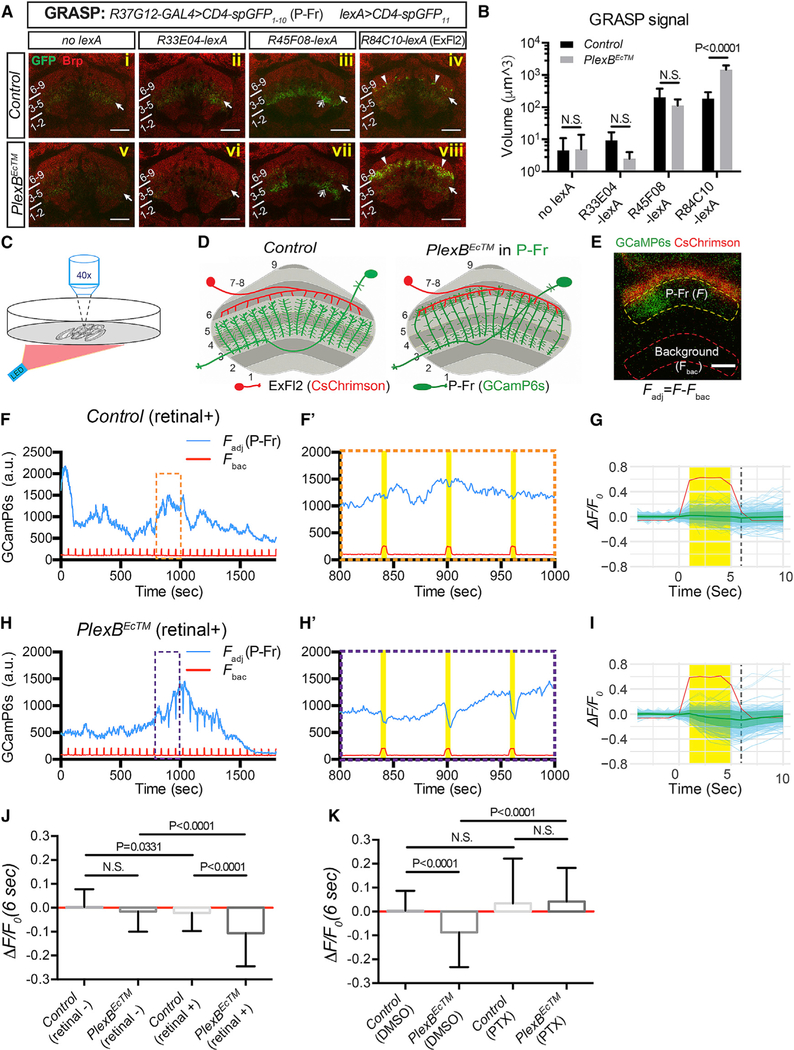
Figure 5. P-Fr Process Lamination Defects Lead to Ectopic Inhibitory Synaptic Input from ExFl2 Neuron Axons.
(A) GFP reconstitution across synaptic partners (GRASP) was used to probe potential synaptic connections between P-Fr processes and other neurons that innervate FB layer 6 (R33E04-lexA and R45F08-lexA for small-field neurons and R84C10-lexA for large-field ExFl2 neurons). The CD4-spGFP1–10 was expressed in P-Fr neurons using R37G12-GAL4, and CD4-spGFP11 was expressed in different lexA-expressing neuronal populations. GRASP signals were examined through the use of a rabbit anti-GFP antibody. Weak GFP staining was observed in all conditions with or without lexA drivers (arrows) suggesting that this antibody weakly recognizes spGFP1–10. Stronger GFP immunolabeling was seen in layer 3 when the R45F08-lexA driver was used (double arrows in [iii] and [vii]), showing that this antibody strongly recognizes reconstituted GFP. Strong, punctated, GFP signals were detected near the lower boundary of layer 6 (arrowheads in [iv]) or within layer 6 (arrowheads in [viii]) only when the R84C10-lexA driver was used to express CD4-spGFP11 in ExFl2 neurons. Strong GRASP reconstitution signals in the control conditions are quite sparse (iv) as compared to GRASP signals when PlexBEcTM is expressed in P-Fr neurons (viii).
(B) Quantification of the total volume of all voxels that have GFP immunolabeling above the defined threshold across all brains (see Star Methods) in the FB for GRASP experiments shown in (A) (n = 8 brains for each genotype).
(C) Schematics showing the experimental strategy for ex vivo two-photon Ca2+ imaging (920 nm) paired with optical stimulation (620 nm, 0.338 mW/cm2).
(D) Schematics presenting the experimental design (E–K) for examining synaptic connections between ExFl2 axons (expressing CsChrimson-mtdT) and P-Fr processes (expressing GCaMP6s).
(E) A live imaging snapshot shows CsChrimson-mtdT (red) expression in ExFl2 axons and GCaMP6s (green) in P-Fr processes in the FB. The average GCaMPfluorescence intensity was measured in two identical contours: one inside the FB (within yellow dashed line) for GCaMP6s fluorescence in P-Fr processes (F), and a second outside of the FB (within red dashed line) for background calibration (Fbac). The difference between fluorescence measurements in these two contours gives rise to the adjusted CCaMP6s fluorescence in P-Fr processes (Fadj = F-Fbac). P-Fr processes can be activated in a column-specific fashion, as shown here by the increase of GCaMP fluorescence only on the left side of the FB. All imaging was performed in the presence of TTX.
(F) A representative trace shows dynamic changes of adjusted GCaMP6s fluorescence in P-Fr processes (blue line) and background fluorescence (red line) duringa 30 min imaging period in in a control brain. The pulsed increases in background fluorescence serve as internal indicators of LED stimulation events (on for 5 s per min). Three stimulation events (orange box) are expanded and shown in (F’). No correlation between LED stimulation and GCaMP fluorescence in P-Fr processes was noted in the control (yellow bars).
(G) Individual stimulation events (4 s prior to LED on, 5 s during LED on, and 5 s after LED off) are overlaid and GCaMP fluorescence changes are shown as ΔF/F0 (light blue for individual events and green lines and margins for mean ± SD). Time 0 is the time point just before the LED light is on. F0 is the average of Fadj 4 s (time point−3 to 0 s) before the LED is on. ΔF = Fadj –F0 for each time point is shown. See Star Methods for additional details. The ΔF/F0 at 6 s (dashed black line) is plotted in (J) and (K) for comparisons among different genotypes and conditions. The red line shows the average background fluorescence changes, which include many larger peak amplitudes than P-Fr fluorescence changes (light blue lines), and these do not differ between experimental and control animals. The y axis only represents the scale of P-Fr but not background fluorescence changes. A total of 301 trials from 22 brains is shown here.
(H and I) Examples and cumulative analyses of GCaMP6s fluorescence changes in P-Fr processes in PlexBEc brains (otherwise similar to [F]–[G]). GCaMP6s fluorescence transiently decreases following each LED stimulation. A total of 266 trials from 22 brains is shown in I.
(J) Quantification of ΔF/F0 (6 s) in control and PlexBEcTM groups, without or with all-trans retinal feeding (n = 186 events for control [retinal]; n = 220 for PlexBEcTM [retinal]; n = 301 for control [retinal+]; n = 266 for PlexBEcTM [retinal+]; a total of 7–22 brains was imaged for each condition). LED stimulation results in a negative shift of ΔF/F0 only when PlexBEcTM-expressing flies are fed with retinal. N is the number of LED stimulation events quantified (F0 > 200 a.u.) in(J) and (K).
(K) Quantification of ΔF/F0 (at 6 s post-LED on) in control and PlexBEcTM groups without or with picrotoxin (PTX, 10 μM) in the bath with the imaged brains (n = 214 trials for control [DMSO]; n = 213 for PlexBEcTM [DMSO]; n = 240 for control [PTX]; n = 239 for PlexBEcTM [PTX]; eight brains were imaged for each condition). All flies were fed retinal. PTX treatment abolished the strong negative responses elicited by LED stimulation in the control brains and in the PlexBEcTM group. Two-way ANOVA with multiple comparisons was performed for (B); one-way ANOVA with Tukey’s multiple comparisons was used for (J) and (K).
All scale bars represent 20 μm.

