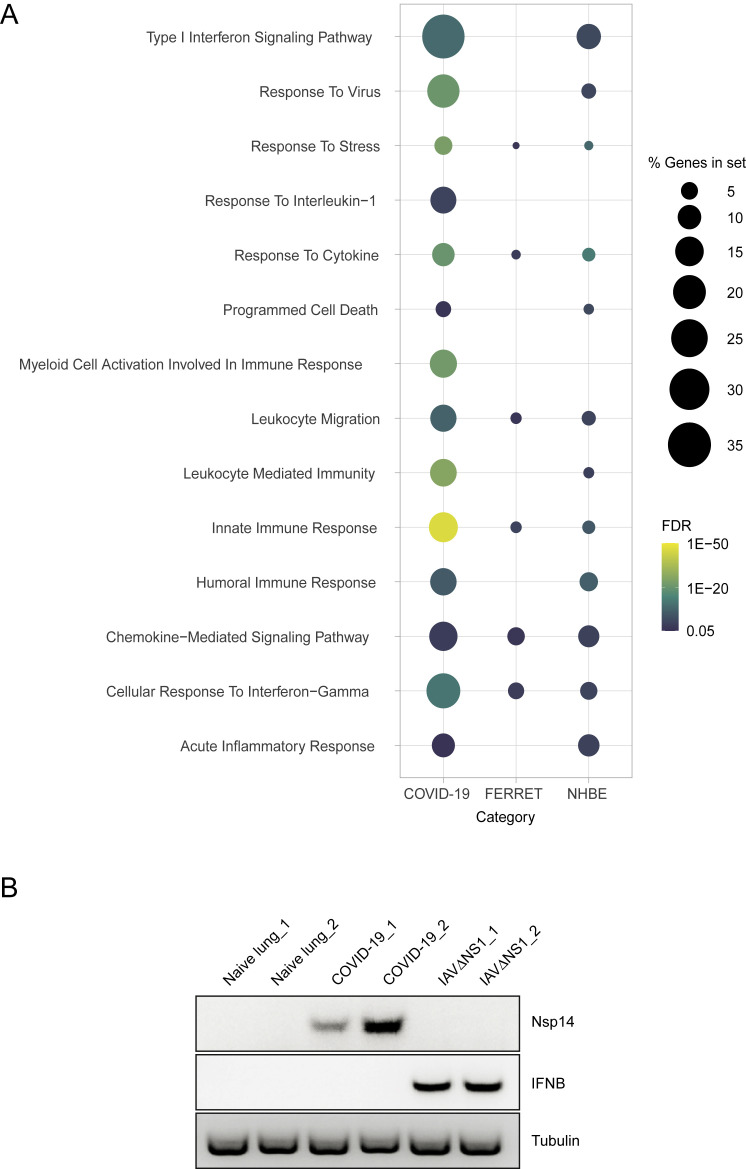
Figure S4.
Unique and Shared Biological Processes between Different Models of SARS-CoV-2 Infection, Related to Figure 4
(A) Dotplot visualization of enriched GO terms in NHBE cells, ferrets and COVID-19 patients. Gene enrichment analyses were performed using STRING against the GO dataset for biological processes. The color of the dots represents the false discovery rate (FDR) value for each enriched GO term and its size represents the percentage of genes enriched in the total gene set. (B) Semiquantitative PCR analysis of healthy and COVID-19 derived lung tissues. Image indicates the relative expression of SARS-CoV-2 nsp14, IFNB and tubulin transcripts in healthy human biopsies and biological replicates of lung tissue from COVID-19 patients. Additionally cDNA of A549 cells infected with IAVΔNS1 are included as controls.

