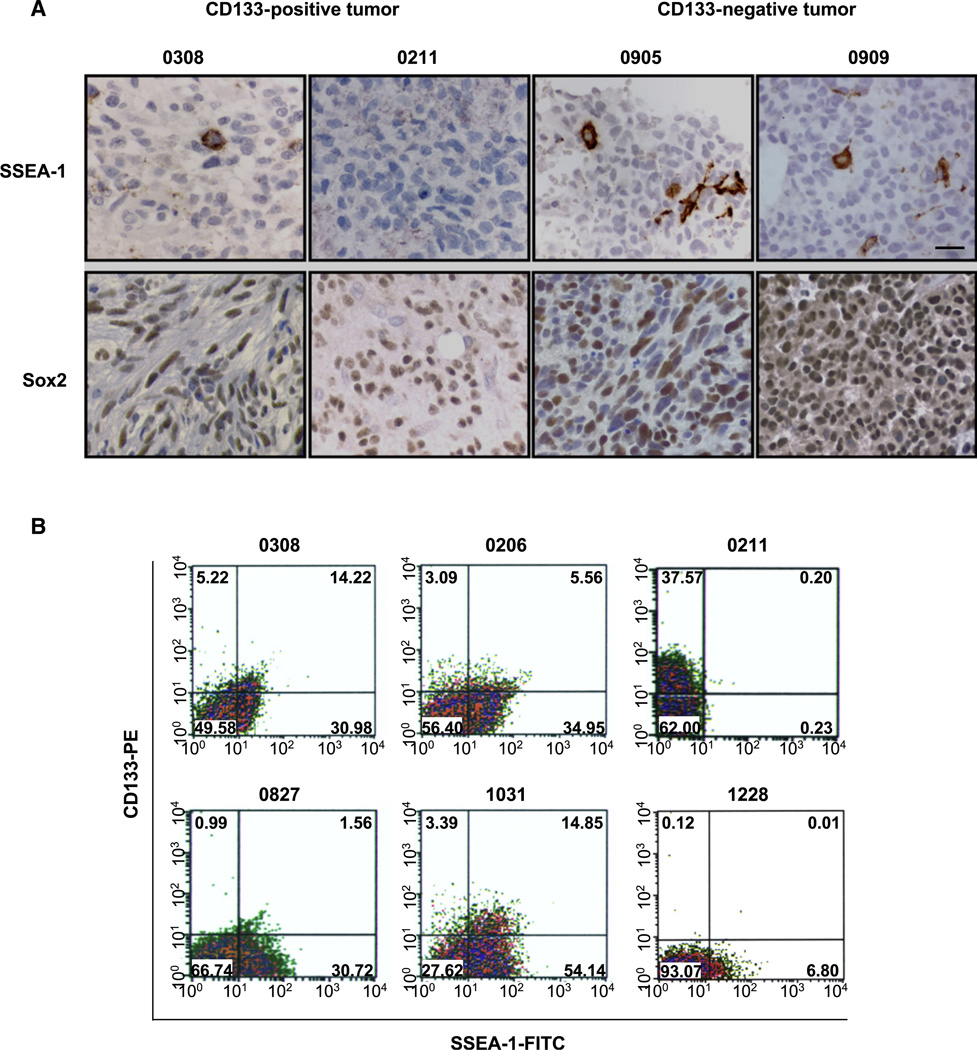
Figure 1. Expression of SSEA-1 in Primary Human GBM Tissues and Their Derivative TSCs/TICs.
(A) Immunohistochemical detection of SSEA-1 and Sox2 in paraffin section from four different patient GBM tissues. Immunopositive cells were visualized by brown DAB staining. The number above represents the designated name for the parental patient GBM tumor. Scale bar represents 20 micron.
(B) Flow cytometry analysis of CD133 (PE labeled, y axis) and SSEA-1 (FITC labeled, x axis) in various TSCs/TICs. Numbers in each quadrate indicate percentage of cells.

