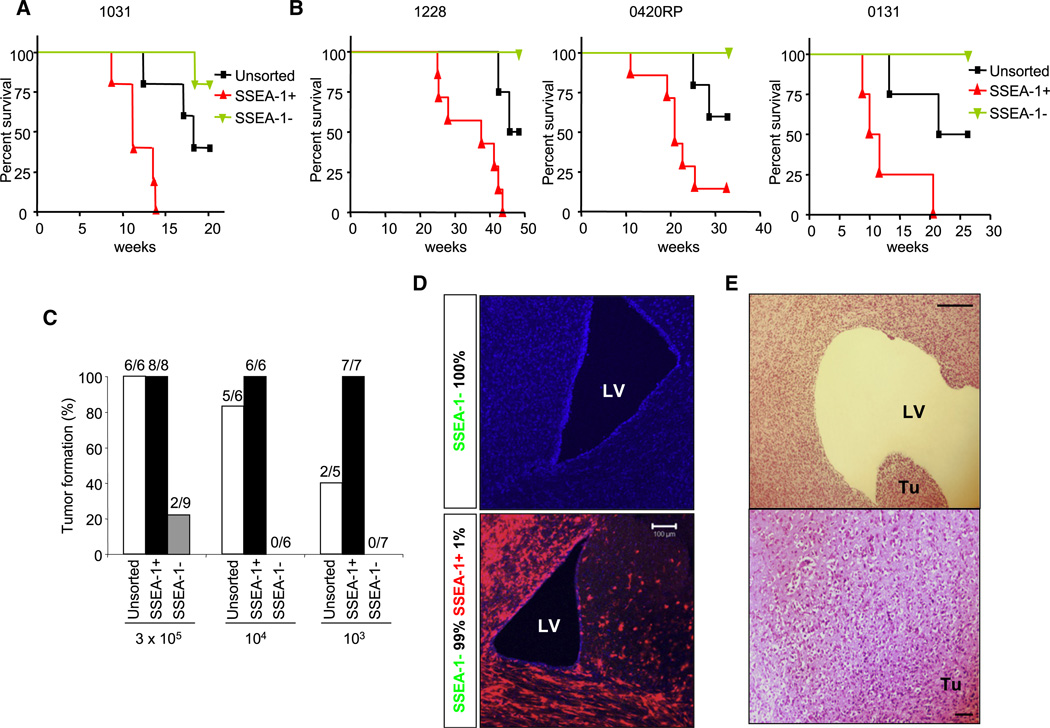
Figure 5. In Vivo Tumorigenic Potential of SSEA-1+ Cells in SCID Mouse Orthotopic Xenograft Models.
(A) Kaplan-Maier survival graphs of animals injected with total (unsorted), SSEA-1+, or SSEA-1− population of acutely isolated GBM cells (1031) at passage zero.
(B) Kaplan-Maier survival graphs of 1228, 0420 RP, and 0131 GBM cells (from left to right). P values were determined by log rank test: p < 0.01.
(C) In vivo tumorigenicity titration of SSEA-1+ versus SSEA-1− 1228 GBM cells. Tumorigenic potential of subpopulation was evaluated by the tumor formation rate.
(D) Lineage tracking of SSEA-1+ versus SSEA-1− GBM cells in vivo. GFP-transduced SSEA-1− cells and RFP-transduced SSEA-1+ GBM cells were mixed at 100: 0 (upper) and 99: 1 ratio (lower) and injected into the brains of adult SCID mice. Immunofluorescence microphotographs were taken to detect GFP and RFP. DAPI (blue) was used to visualize nuclei.
(E) Representative microphotograph of secondary tumor xenograft induced by serial transplantation of SSEA-1+ 1228 GBM cells. Scale bars represents 100 micron.

