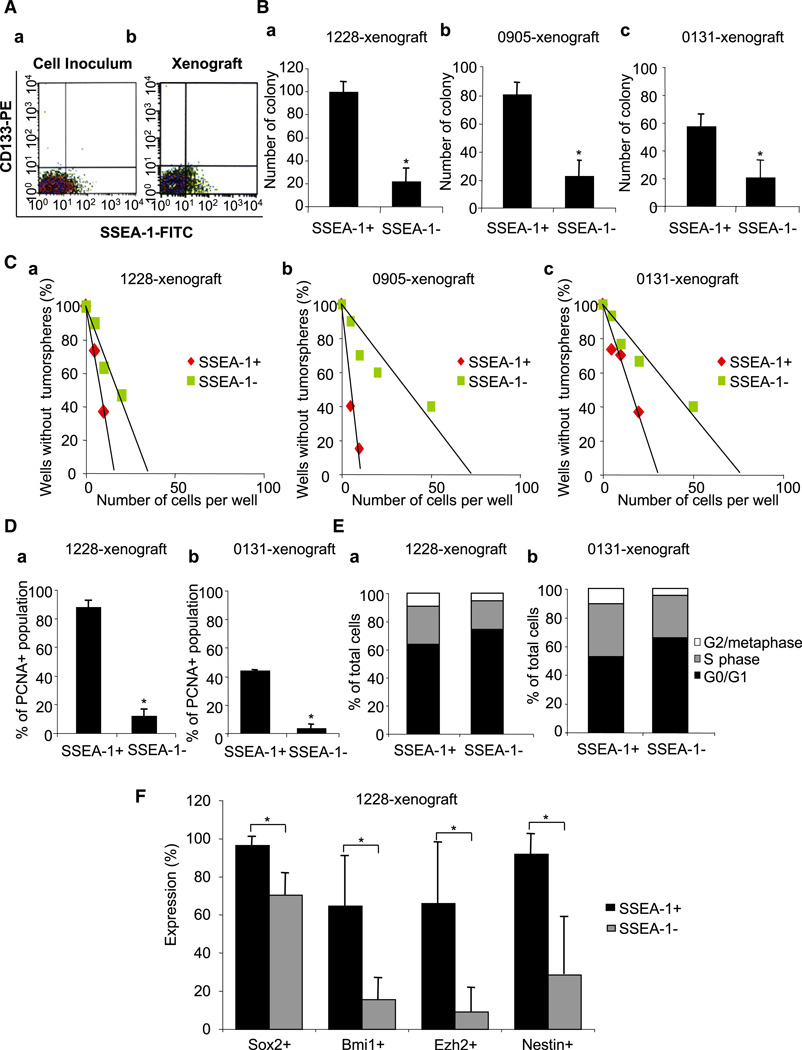
Figure 6. Characterization of SSEA-1+ Cells in SCID Xenograft Tumors In Situ.
(A) FACS analysis to determine the percentage of cells expressing CD133 and/or SSEA-1. Cells prepared for the injection into mice (Aa) and isolated from the resultant xenograft tumors (Ab) were used for the analysis. As a representative example, data from 1228 line were shown. Soft agar colony-forming assay (B) and limiting dilution sphere forming assay (C) were performed in order to determine clonogenicity of SSEA-1+ versus SSEA-1− cells that were acutely isolated from xenograft tumors. These three different tumors were derived from injection of three different GBM lines (1228, 0905, and 0131), respectively. R2 > 0.94. PCNA staining (D) and cell-cycle analysis (E) of xenograft tumors derived from 1228 and 0131 cells were performed by flow cytometry. (F) Expression of stem cell-related genes in SSEA-1+ versus SSEA-1− population of xenograft tumor cells, determined by FACS staining. The tumors were generated by the injection of 1228 SSEA-1+ cells. Error bars represent SD (performed in triplicates); *p < 0.05.

