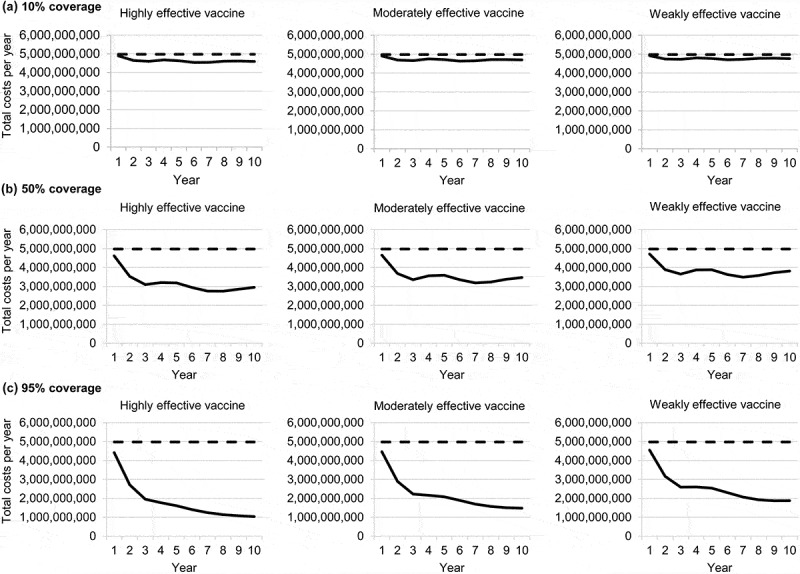
Figure 3.

Total costs per year, by vaccine type and percent coverage.
The horizontal dashed line shows costs in the no vaccine scenario. Costs are undiscounted in 2015 MXN.

Total costs per year, by vaccine type and percent coverage.
The horizontal dashed line shows costs in the no vaccine scenario. Costs are undiscounted in 2015 MXN.