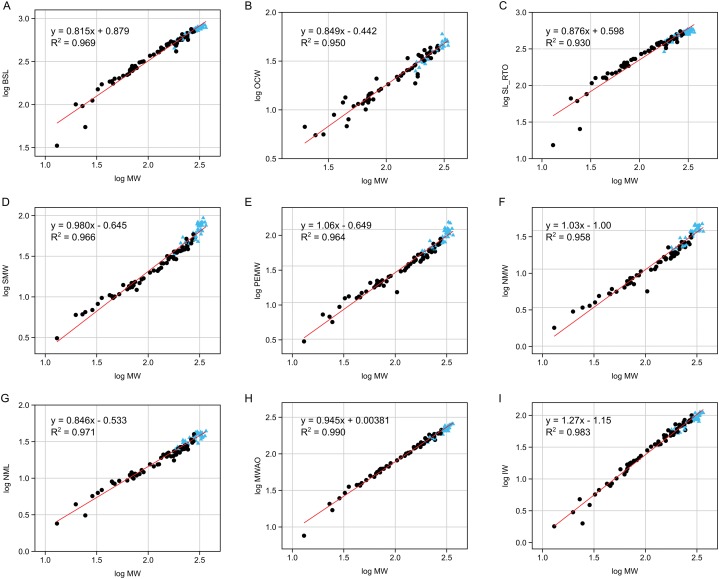
Figure 6. Reduced major axis regressions for nine of the assessed continuous variables.
(A) Log BSL vs. log MW, (B) log OCW vs. log MW, (C) log SL_RTO vs. log MW, (D) log SMW vs. log MW, (E) log PEMW vs. log MW, (F) log NMW vs. log MW, (G) log NML vs. log MW, (H) log MWAO vs. log MW, (I) log IW vs. log MW. Males (possessing narial fossae) are identified with blue triangles. Black dots represent osteologically immature individuals and/or females.

