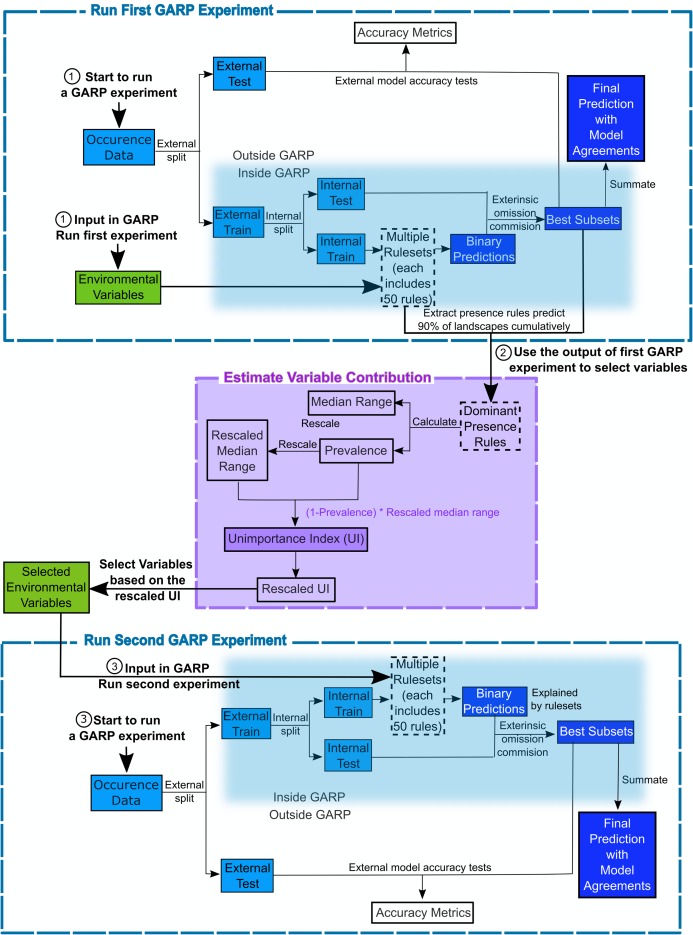
Figure 1. Flowchart depicting the procedure to run a GARP experiment and estimate variable contribution.
There are three steps for predicting species distribution and selecting variables selected via Unimportance Index (UI). First, run a complete GARP experiment with the full variable set. Second, use the output of the first GARP experiment to rank and select variables based on UI. Third, input the important variables in GARP to run the second GARP experiment to predict the species distributions.

