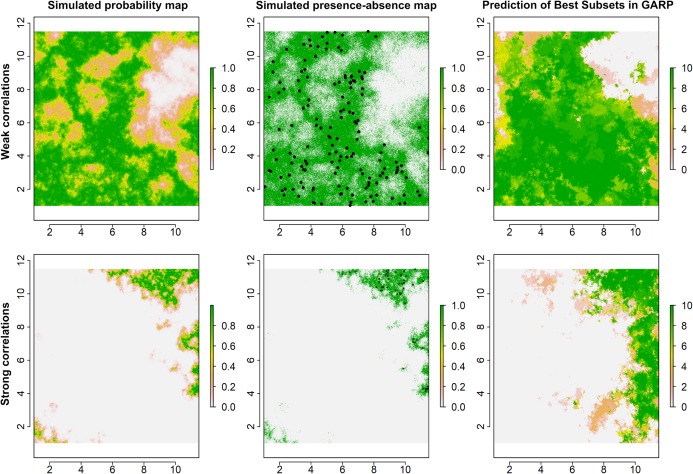
Figure 2. Simulated species distributions, occurrence (presence–absence) maps, and GARP prediction map for the best subset under the two scenarios where the correlation between species occurrence and environment are weak and strong.
The black points are the presence locations extracted from occurrence map for modeling species distributions in GARP.

