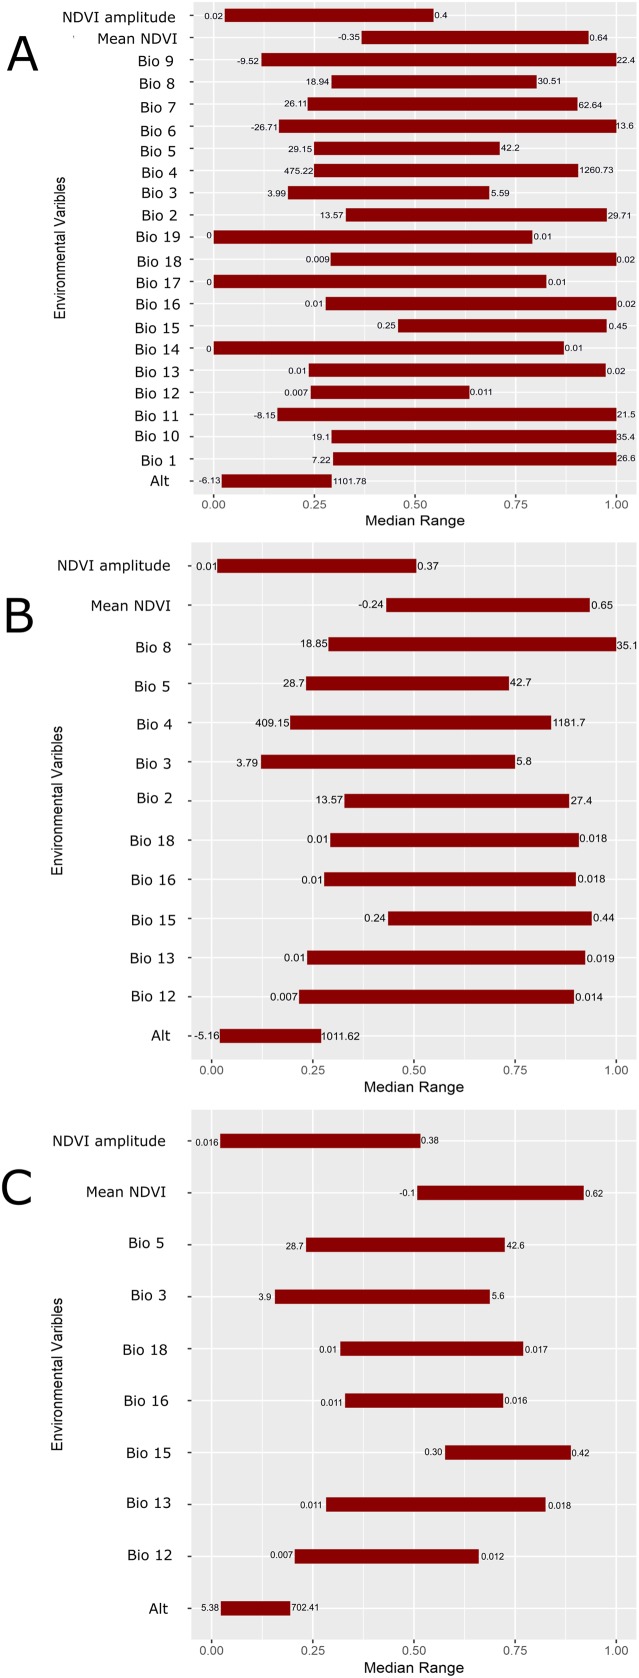
Figure 5. Scaled median range of the covariates from the best subset of each GARP experiment to predict the distribution of Toxostoma rufum in the continental US using all variables (A), those selected with the the UI set to 0.5 (B), and those variables included with UI set to 0.25 (C).
Variables were scaled from 0 to 1 for all covariates. Those with narrower ranges have a greater influence on the predicted distribution in the models. The values on the bars show the actual range of the environmental conditions based on that ecological niche modeling experiment.

