
Figure 2.
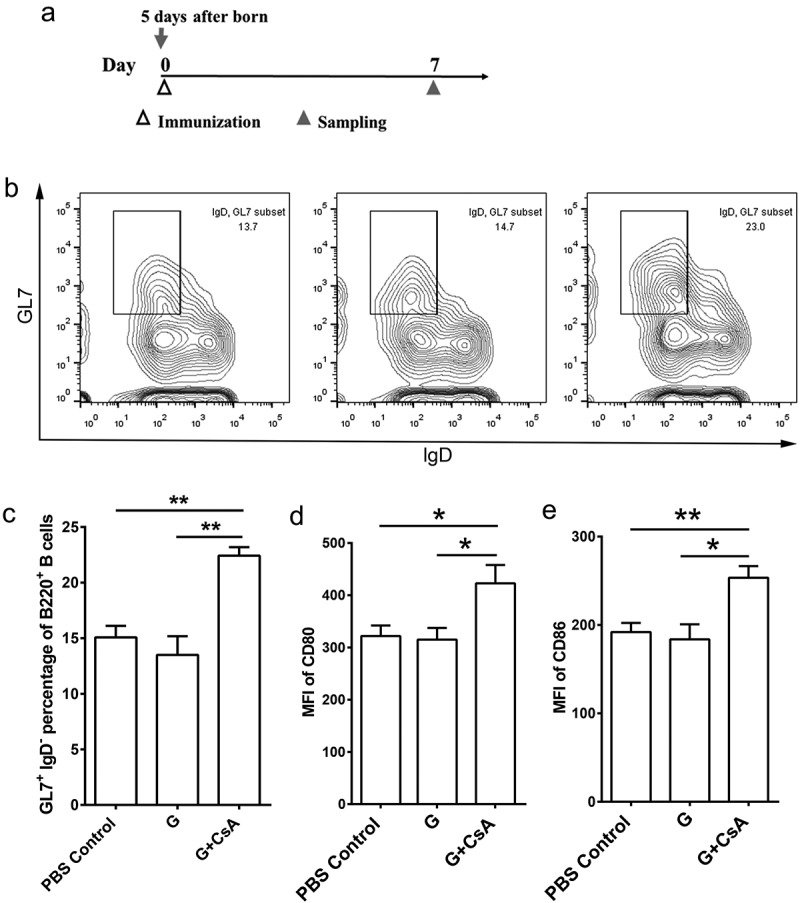
Activation of spleen B cells by the G+ CsA vaccine priming in neonatal mice. (A) Neonatal mice were immunized with vaccines once at day 0 (5 days after birth), and at day 5 the mice were sacrificed for B cell detection in spleens. (B) Representative flow cytometry plots of GC B cells (B220+IgD−GL7+), Left, the PBS control group; Middle, G protein alone group; Right, the G+ CSA group. (C) The frequencies of GC B cells in B220+ splenocytes. (D, E) The expression profile of CD80 (D) and CD86 (E) in B220+ splenocytes are shown as MFI. Data are mean ± SEM of n = 5 mice per group. *P < .05, **P < .01, ***P < .001, ****P < .0001.