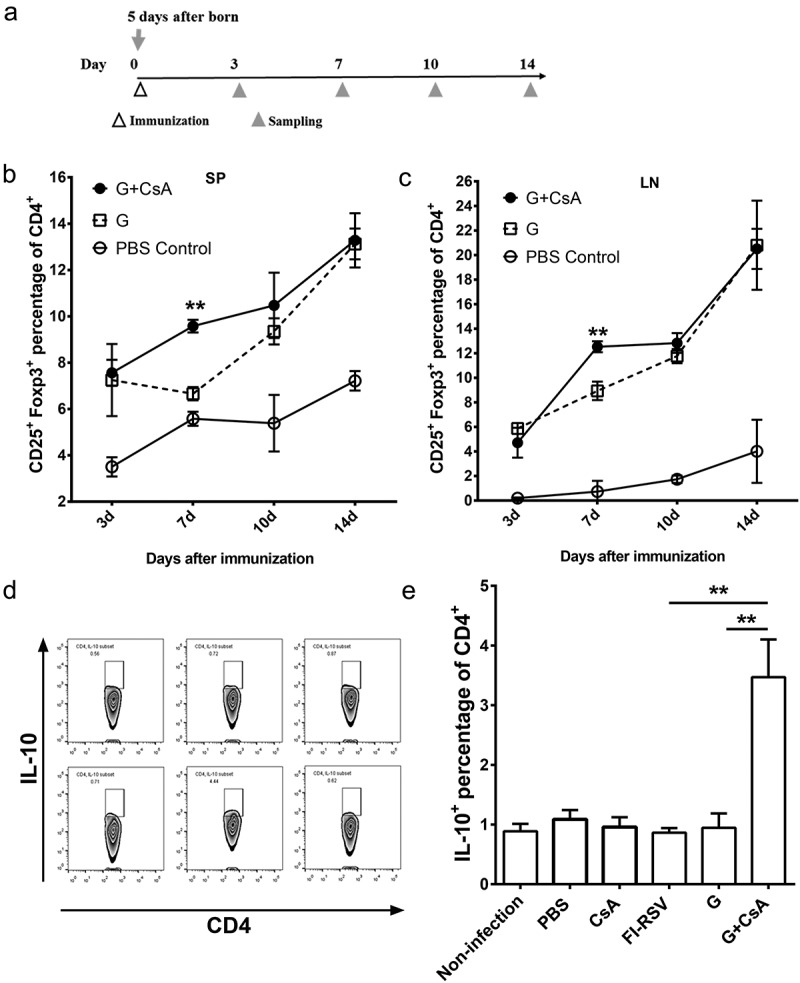
Figure 4.

Treg cells were induced in G+ CsA vaccinated neonatal mice and IL-10 was highly expressed in CD4+ T cells after in vitro stimulation. (A) Schematic outline of testing Treg percentage. Neonates were immunized at day 0 (n = 3), spleen (SP) and lymph node (LN) were sampled at days 3, 7, 10 and 14 for Treg cell detection by flow cytometry. (B) Dynamic changes of Treg cells in spleen and (C) in lymph node. (D) Neonatal mice (n = 3–6) were immunized and challenged as in Figure 1 A. After sacrifice, splenocytes were sampled and stimulated in vitro with G protein for 3 days. IL-10 expression were tested in CD4+ cells by flow cytometry. Results of statistical analysis are shown in histograms of mean ± SEM (E) **P < .01.
