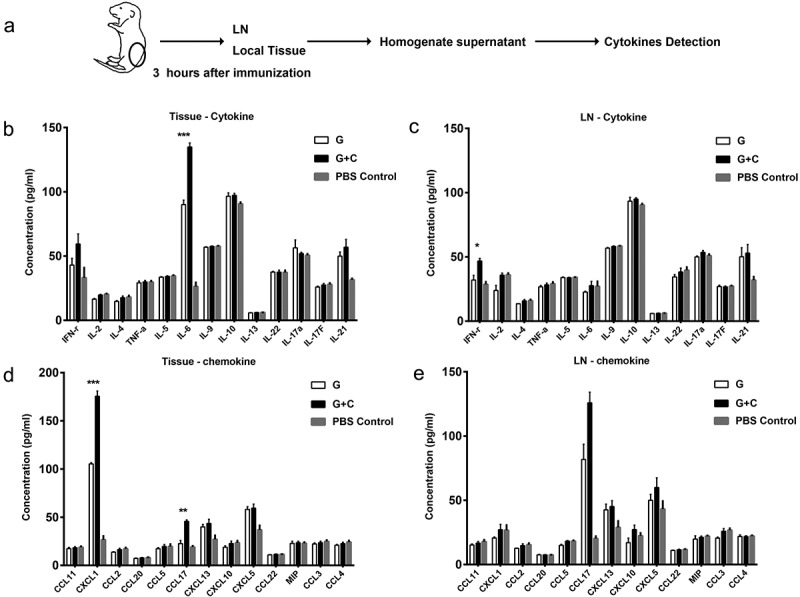
Figure 5.

The expression profiles of cytokines and chemokines in local tissue and lymph node of the G+ CsA injection site. (A) Schematic outline . Three hours after neonate immunization (n = 4), local tissue and lymph node near the injection site were sampled for homogenization. The supernatants were screened against the cytokine panel (B and D) and the chemokine panel (D and E) of the Legengplex cytokine panel kit. Statistical analysis compared G+ CsA vaccine group and G protein alone group. Data are mean ± SEM, *P < .05, ***P < .001.
