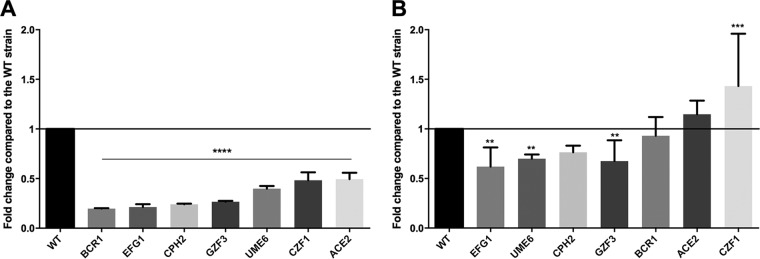
FIG 10.
Expression levels of genes involved in pseudohypha and biofilm formation. Genes related to filamentous growth and biofilm formation were examined by qPCR analysis. Expression levels of the selected 7 genes were compared relative to the normalized WT values (WT value = 1). Gene expression analysis performed after growth in Spider medium at 37°C for 24 h (A) and in YPD medium at 30°C for 4 h (B). Statistical significance was determined using one-way ANOVA with Dunnett’s post hoc test (**, P ≤ 0.01; ***, P ≤ 0.001; ****, P ≤ 0.0001).

