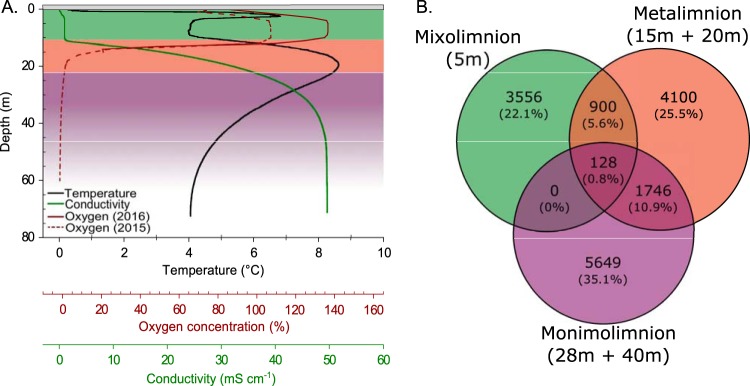
FIG 2.
Chemical and biological stratification of the Lake A water column. (A) Profiles of temperature (black), specific conductivity (green), and oxygen concentrations (red). The oxygen profile represents a combination of measurements below 22 m from 2015 (dotted line) and 2016 (unbroken line). Bottom waters (monimolimnion) were anoxic, with an oxygen concentration of 0% at 22 m. The light gray rectangle represents the 92 cm of lake ice cover. (B) Venn diagram showing the proportions of vOTUs shared among the lake strata. The percentage of shared vOTUs for each section is shown in parentheses. In both figures, the three strata of the lake are indicated by color as follows: green, mixolimnion; red, metalimnion; purple, monimolimnion.

