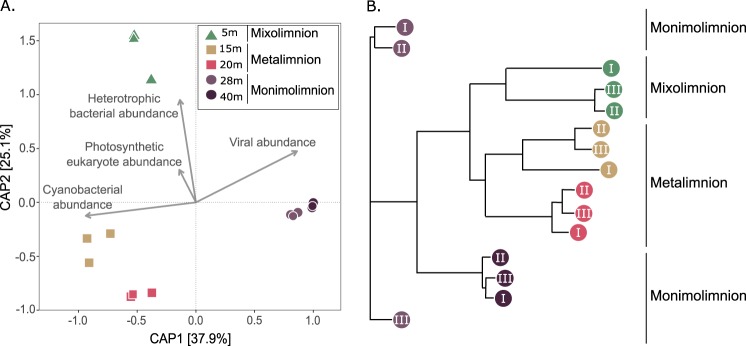
FIG 4.
Viral diversity by depth. (A) Constrained analysis of principal coordinates (calculated with Bray-Curtis dissimilarity), including flow cytometry counts of major host groups and viruses. The proximity of a host group (vectors) to a particular viral community (shapes) is an indicator of the strength of the association. (B) Neighbor-joining tree of all depths and replicates color coded by depth.

