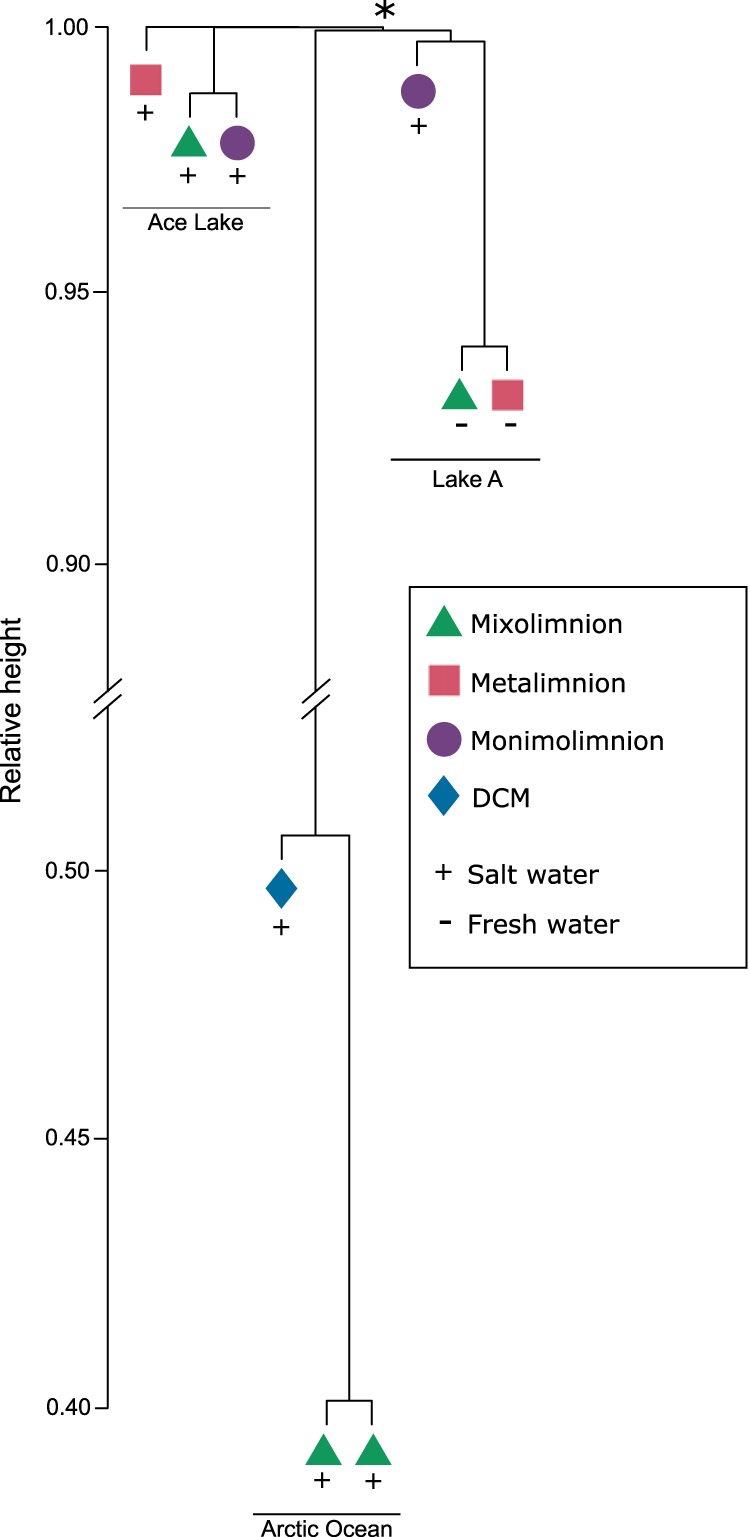
FIG 7.

Comparison of Lake A, Ace Lake, and Arctic Ocean viral communities. The dendrogram shows Lake A data for depths 5 m (mixolimnion), 15 m (metalimnion), and 40 m (monimolimnion); Ace Lake data for depths 5 m (mixolimnion), 12.7 m (metalimnion), and 23 m (monimolimnion) (28); and three ocean samples from the Tara Polar expedition (station 196, 5 m; station 194, 5 m and 35 m) (33). The asterisk denotes the node of a clade that includes the Arctic Ocean and Lake A samples.
