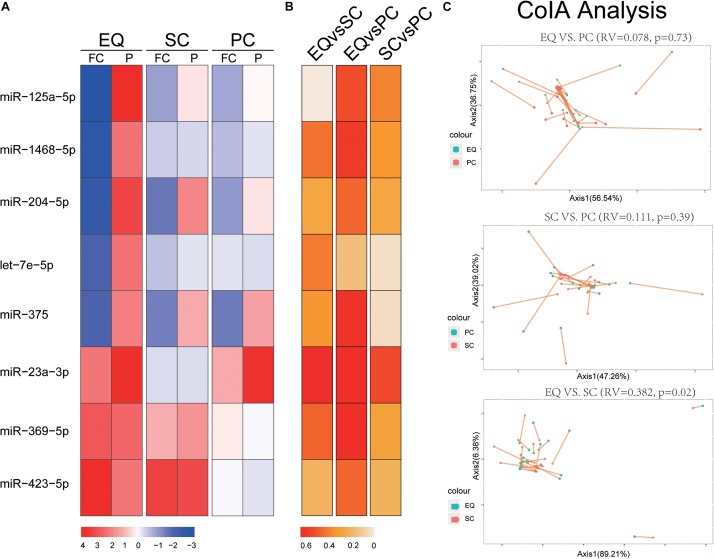
FIGURE 4.
Validation of candidate miRNAs by SC and PC. (A) Fold change (FC) and p-value of candidate miRNA expression in AD samples, FC and p-value were calculated by DESeq2. (B) Spearman Correlation coefficients of miRNA expression between EQ, SC, and PC. (C) Co-inertia analysis of the relationships between EQ, SC, and PC. Monte-Carlo test was carried out, and the significance of correlation could be observed between EQ and SC (p < 0.05). Each sample is represented with two dots connected by a thin line.

