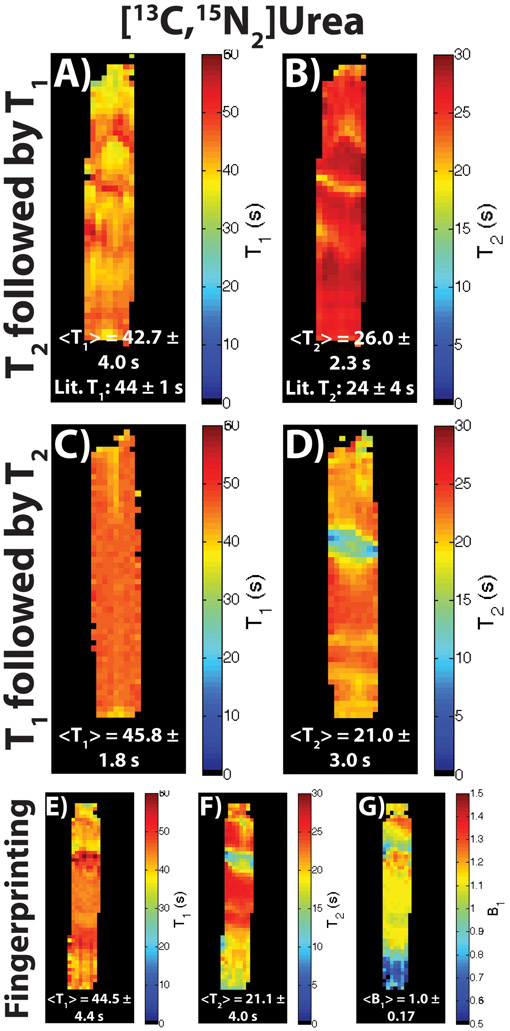
Figure 3:
Resulting T1, T2, and B1 maps in a hyperpolarized [13C,15N2]urea phantom for all three types of acquisitions described. (A,B) T1 and T2 maps for a dual module acquisition (T2 mapping module followed by a T1 mapping module). The acquisition was similar to the one depicted in Figure 2A, except with more T2 time-points acquired due to the long solution state T2 of the compound. (C,D) T1 and T2 maps for a different iteration of the dual module acquisition (T1 mapping module followed by a T2 mapping module). The acquisition was similar to the one depicted in Figure 2B, except with more T1 and T2 time-points acquired due to the long solution state T1 and T2 of the compound. (E-G) T1, T2, and B1 maps for a modified MR fingerprinting approach, with the acquisition similar to the one depicted in Figure 2C, except with more T1 and T2 time-points acquired due to the long solution state T1 and T2 of the compound. For all three acquisitions, the resulting mean ± intra-map standard deviation agreed well with the literature value for all the T1 and T2 maps. The B1 also had a mean of 1.0, which is expected with a stationary syringe centered in a volume coil. Deviations in values in the S/I direction for all maps can be attributed to some B0 inhomogeniety, as well as some B1 drop-off at the edge of the coil.

