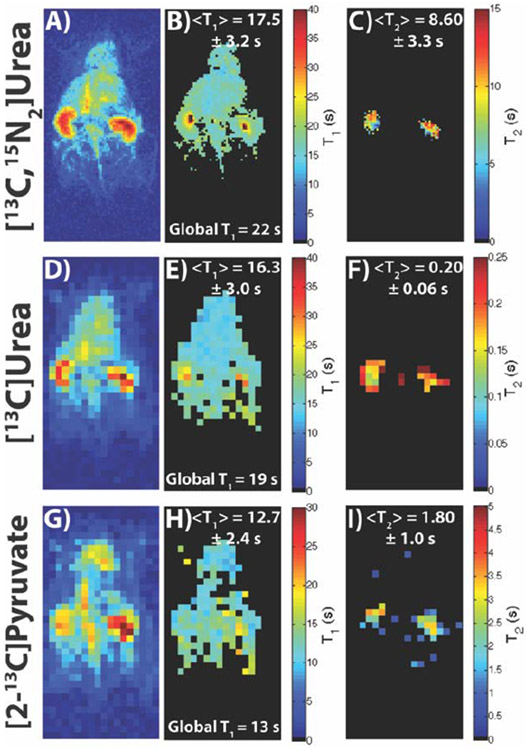
Figure 6:
Depiction of a representative time-point, T1 map, and T2 map for [13C,15N2]urea (A-C), [13C]urea (D-F), and [2-13C]pyruvate (G-I) from a dual module acquisition (T1 mapping followed by T2 mapping) (N = 1 for all compounds). The T1 maps matched up well with the global T1 as well as the HP001 T1 maps in Figures 4-5, with the longest T1’s seen in the kidneys. The T2 maps of each compound matched up well with previously acquired maps, with the longest T2 values seen in the kidneys due to renal filtration. Additionally, the [13C,15N2]urea maps showed the capability of 1.25 x 1.25 mm2 spatial resolution for T1/T2 mapping. For 1H anatomical image, see Figure 7A.

