
Table 6.
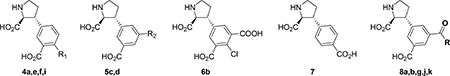
Chemical structures and functional characterization at GluN1/GluN2A-D NMDA receptors. All values in μM.
 | ||||||
|---|---|---|---|---|---|---|
| R | Native NMDA (Ki) | GluN1/2A (IC50) | GluN1/2B (IC50) | GluN1/2C (IC50) | GluN1/2D (IC50) | |
| 4a | R1= H | 6.0 | 11.8 ± 0.23 | 34.5 ± 0.97 | 91.2 ± 2.60 | > 100 |
| 4e39 | R1= Cl | 0.63 | 4.7 | 10 | 24 | 41 |
| 4g | R1= Br | 0.6239 | 1.83 ±0.11 | 6.15 ± 0.17 | 21.4 ± 1.09 | 25.5 ± 1.46 |
| 4h | R1= COOH | 1.3 | 0.75 ± 0.03 | 4.24 ± 0.13 | 5.17 ± 0.12 | 24.3 ± 1.46 |
| 5c | R2= COOH | 0.48 | 0.63 ± 0.01 | 4.37 ± 0.17 | 6.27 ± 0.13 | 21.2 ± 0.37 |
| 5d | R2= triazole | 0.83 | 1.36 ± 0.06 | 3.51 ± 0.18 | 7.28 ± 0.17 | 18.5 ± 1.54 |
| 6b | -- | 0.16 | 0.20 ± 0.02 | 0.75 ± 0.04 | 1.33 ± 0.03 | 5.15 ± 0.23 |
| 7 | -- | 8.5 | 45 ± 1.5 | 165 ± 14.1 | 193 ± 6.1 | 159 ± 8.7 |
| 8a | Gly | 0.60 | 1.32 ± 0.05 | 5.76 ± 0.22 | 9.94 ± 0.52 | 44.30 ± 7.90 |
| 8b | L-Ala | 0.87 | 1.64 ± 0.07 | 7.17 ± 0.17 | 11.55 ± 0.62 | 33.84 ± 4.47 |
| 8g | L-Tyr | 0.96 | 1.87 ± 0.08 | 1.73 ± 0.05 | 9.70 ± 0.48 | 25.20 ± 1.46 |
| 8j | L-Pro | 1.1 | 1.00 ± 0.06 | 2.89 ± 0.10 | 4.50 ± 0.22 | 34.79 ± 12.25 |
| 8k | L-Glu | 0.83 | 0.61 ± 0.06 | 3.89 ± 0.22 | 2.61 ± 0.07 | 23.50 ± 1.00 |
Inhibition of recombinant NMDA receptor subtypes measured using two-electrode voltage-clamp recordings. IC50 values for inhibition of current responses activated by co-application of 100 μM glycine and 1 μM Glu to Xenopus oocytes expressing recombinant rat GluN1/GluN2A-D NMDA receptors were determined from 5–6 oocytes and Ki values were estimated using the Cheng-Prusoff relationship54 and previously determined Glu EC50 values55. Ki values are mean ± SEM