Figure.

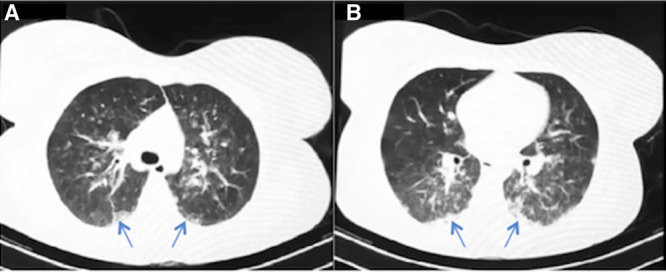
Axial view of a lung CT 4 h after extubation. It revealed bilateral multilobar patchy opacities (arrows) predominantly in posterior and peripheral regions (A and B). CT indicates computed tomography.

Axial view of a lung CT 4 h after extubation. It revealed bilateral multilobar patchy opacities (arrows) predominantly in posterior and peripheral regions (A and B). CT indicates computed tomography.