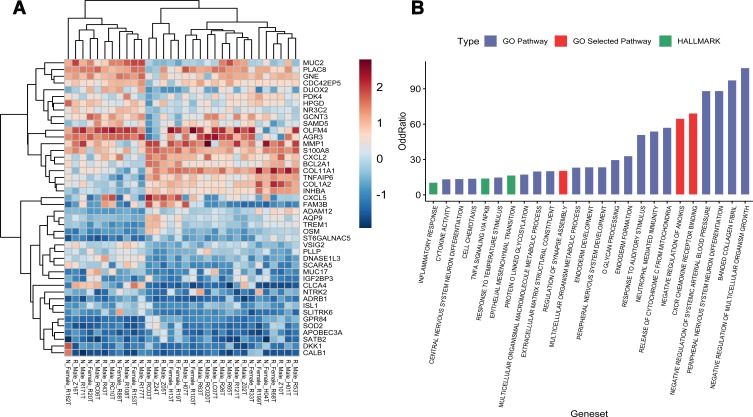
Figure 1.
Gene expression analysis of 16 non-responders (N) and 16 responders (R). (A) Heatmap of the 44 DEGs between the non-responders and the responders. Upregulation is shown in orange and down-regulation in blue. Names of samples are listed at the bottom. The tree view on the left shows the hierarchical cluster analysis of the genes. The names of genes are listed on the right. (B) Significantly enriched GO and HALLMARK pathways of the DEGs.

