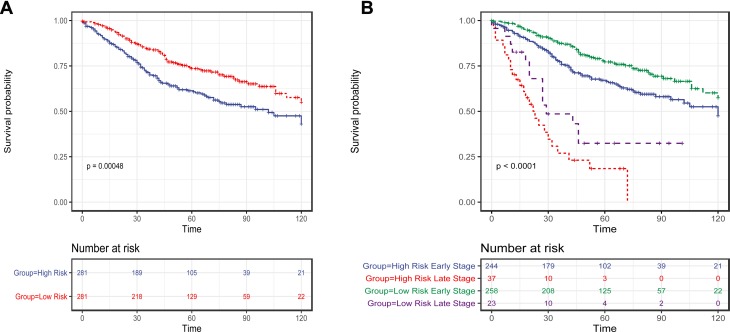
Figure 3.
The Kaplan–Meier method was used to estimate the OS of patients in the training set using the 15-mRNA signature. (A) The Kaplan–Meier curves for patients in GSE39582 microarray cohort (N = 562); (B) The Kaplan–Meier curves for patients in GSE39582 microarray cohort (N = 562), which stratified by metastasis status. The tick marks on the Kaplan–Meier curves represent the censored subjects. The differences between the two curves were compared by the two-sided Log rank test.

