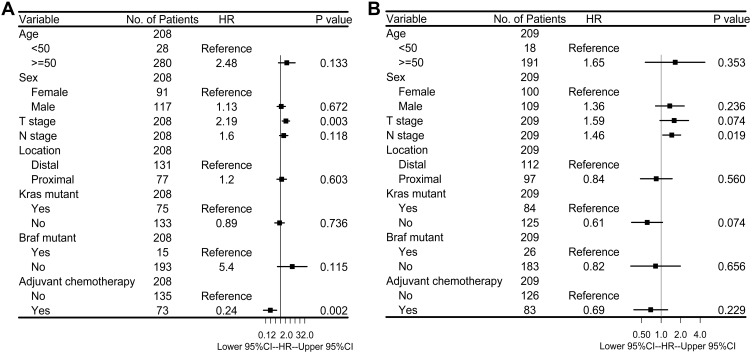
Figure 6.
(A) Multivariate Cox proportional hazards regression analysis of low-risk CRC patients in stages I–III (N=208). (B) Multivariate Cox proportional hazards regression analysis of high-risk CRC patients in stages I–III (N=209). Multivariables included age at the time of diagnosis, sex, T stage, N stage, anatomical location of primary tumor, adjuvant chemotherapy and mutation status in KRAS and BRAF genes. T stage, N stage were taken as continuous variables into account, while other factors were as categorical variables. Solid tetragonums represent the HR of death, and open-ended horizontal lines represent 95% CIs. All P-values were calculated by using Cox regression analysis.

