Figure 6.

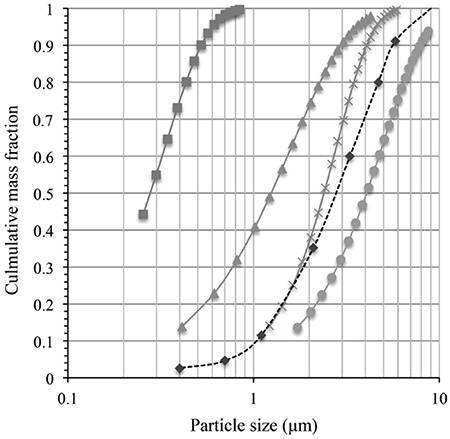
PSD by mass across particle sizes at the outlet of each individual stage as simulated outlet: Stage 1 (□), Stage 1 (□), Stage 3 (□), Stage 4 (□) and experimental data (□), spraydried mannitol
PSD: Particle size distribution

PSD by mass across particle sizes at the outlet of each individual stage as simulated outlet: Stage 1 (□), Stage 1 (□), Stage 3 (□), Stage 4 (□) and experimental data (□), spraydried mannitol
PSD: Particle size distribution