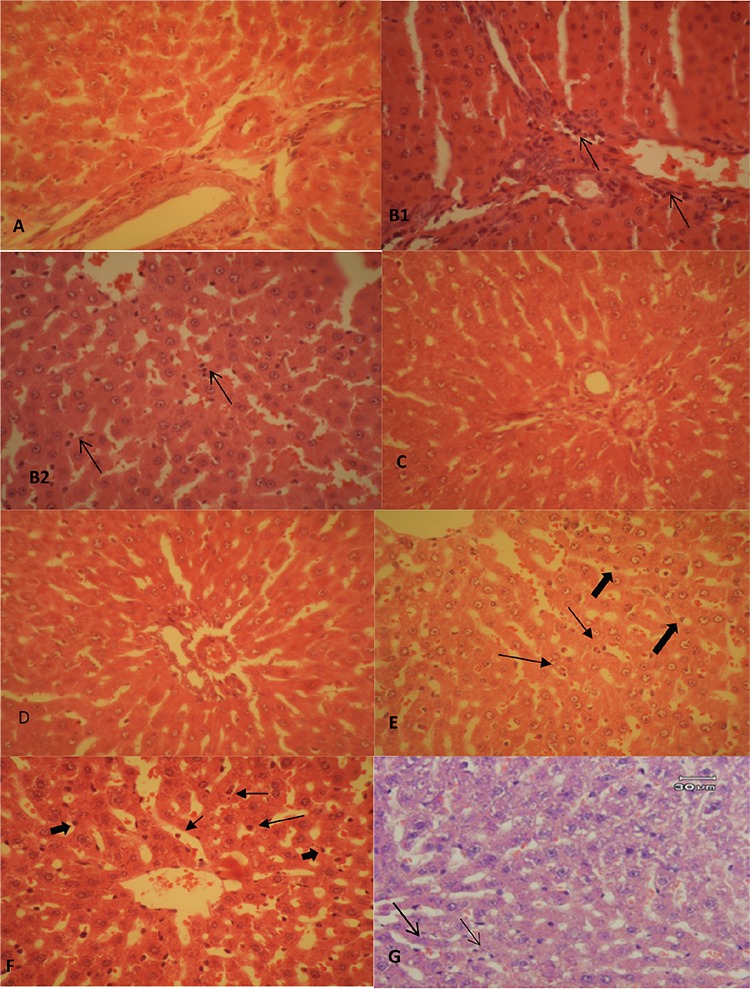
Figure 1.

Histopathological studies. A) LAP group, the portal tract and the hepatocytes in normal condition. B1) CLP group, neutrophil infiltration in the portal tract (arrows). B2) CLP group, neutrophil infiltration in the sinusoids that can be seen easily with their dark nuclei (arrows). C) DDW15 group, the portal tract and the parenchyma in normal condition. H and E, 400×. D) DDW30 group, the portal tract and the parenchyma in normal condition. H and E, 400×. E) DDW15+RD, presence of a few neutrophils in the sinusoids (thin arrows). Kupffer cells can also be seen in the picture (thick arrows). H and E, 400×. F) DDW30+RD group, neutrophil infiltration in the sinusoids (thin arrows). Kupffer cells showing hypertrophy and hyperplasia are also obvious (thick arrows). H and E, 400×. G) Indomethacin group, a few infiltrated neutrophils (arrows) can be seen. H and E, 400×
LAP: Laparotomy, CLP: Cecal ligation and puncture, DDW: Deuterium-depleted water, RD: Rosa damascena Mill, H: Hematoxylin, E: Eosin
