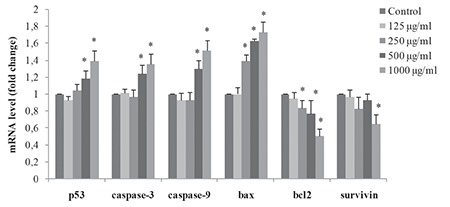
Figure 6.

DMSA/Ag2S QDs-induced apoptosis in V79 cells. Cells were exposed to DMSA/Ag2S QDs at the dosages of 0, 125, 250, 500, and 1000 μg/mL for 24 h. At the end of exposure, mRNA levels of the p53, caspase-3, caspase-9, Bax, Bcl2, and survivin genes were measured as described in the Materials and Methods. Results were given as the mean ± standard deviation. The real-time polymerase chain reaction (RT PCR) arrays were analyzed by t-test. Significance in the PCR array was determined based on fold change from the control ΔΔCt value. *Significant difference as compared to the negative control (p<0.05). Negative control (1% PBS)
Ag2S: Silver sulfide, QDs: Quantum dots, DMSA: Meso-2,3-dimercaptosuccinic acid, PCR: Polymerase chain reaction, PBS: Phosphate buffered saline
