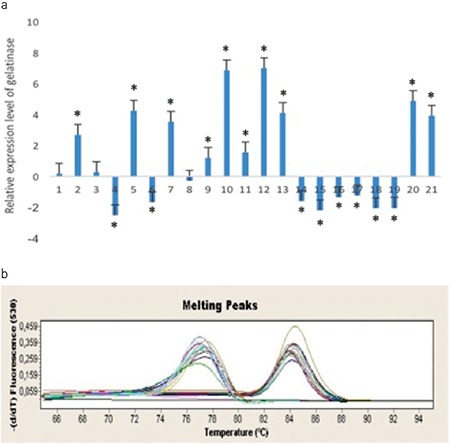
Figure 3.

Gelatinase gene relative expression ratios of Enterococcus faecalis ATCC 29212 and clinical isolates in planktonic and biofilm cells.
*: Statistically significant (p value<0.05), (a, b) Melting curves of gelE and 16srRNA (housekeeping gene) of the bacteria, respectively
