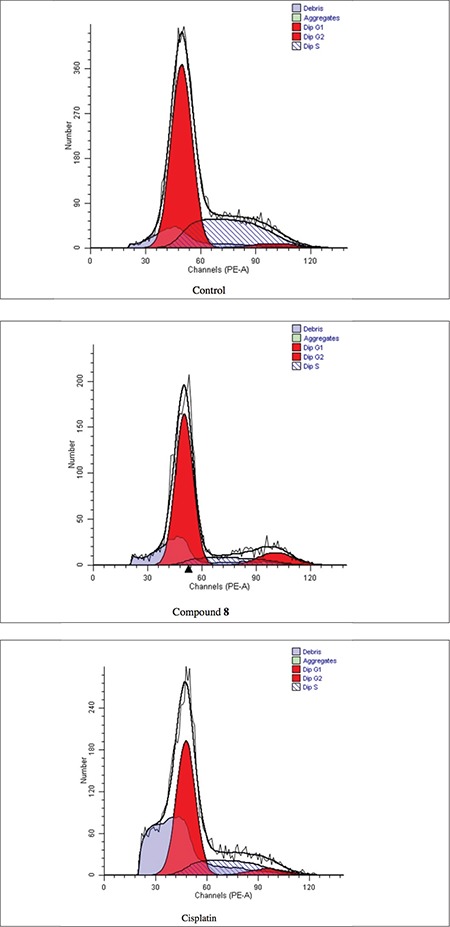
Figure 7.

Cell cycle distribution of A549 cells treated with IC50 concentration of compound 8 and cisplatin for 24 h. At least 10,000 cells were analyzed per sample. Blue color shows debris, green color shows aggregates, and red color shows cells in G1 and G2 phases
