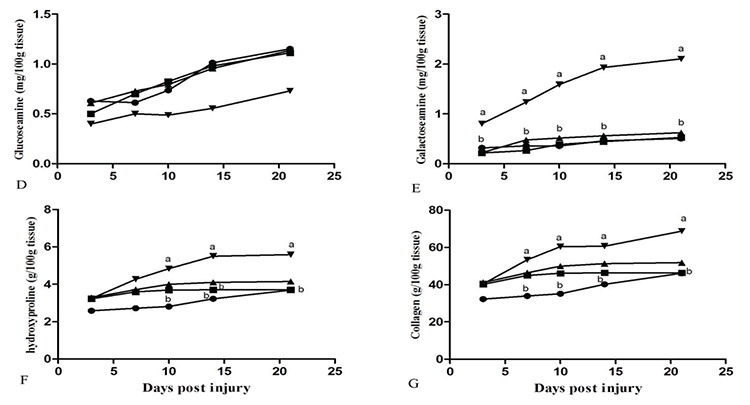
Figure 4.

Pattern of changes in biochemical parameters in the lesions of the of the control (●), base gel (■), 5% Bene (▲) and 10% Bene (▼) rats at different time points (day), values are expressed as mean ± standard error of the mean a, b and c show significant differences (p<0.05) between groups at different days post injury are indicated
