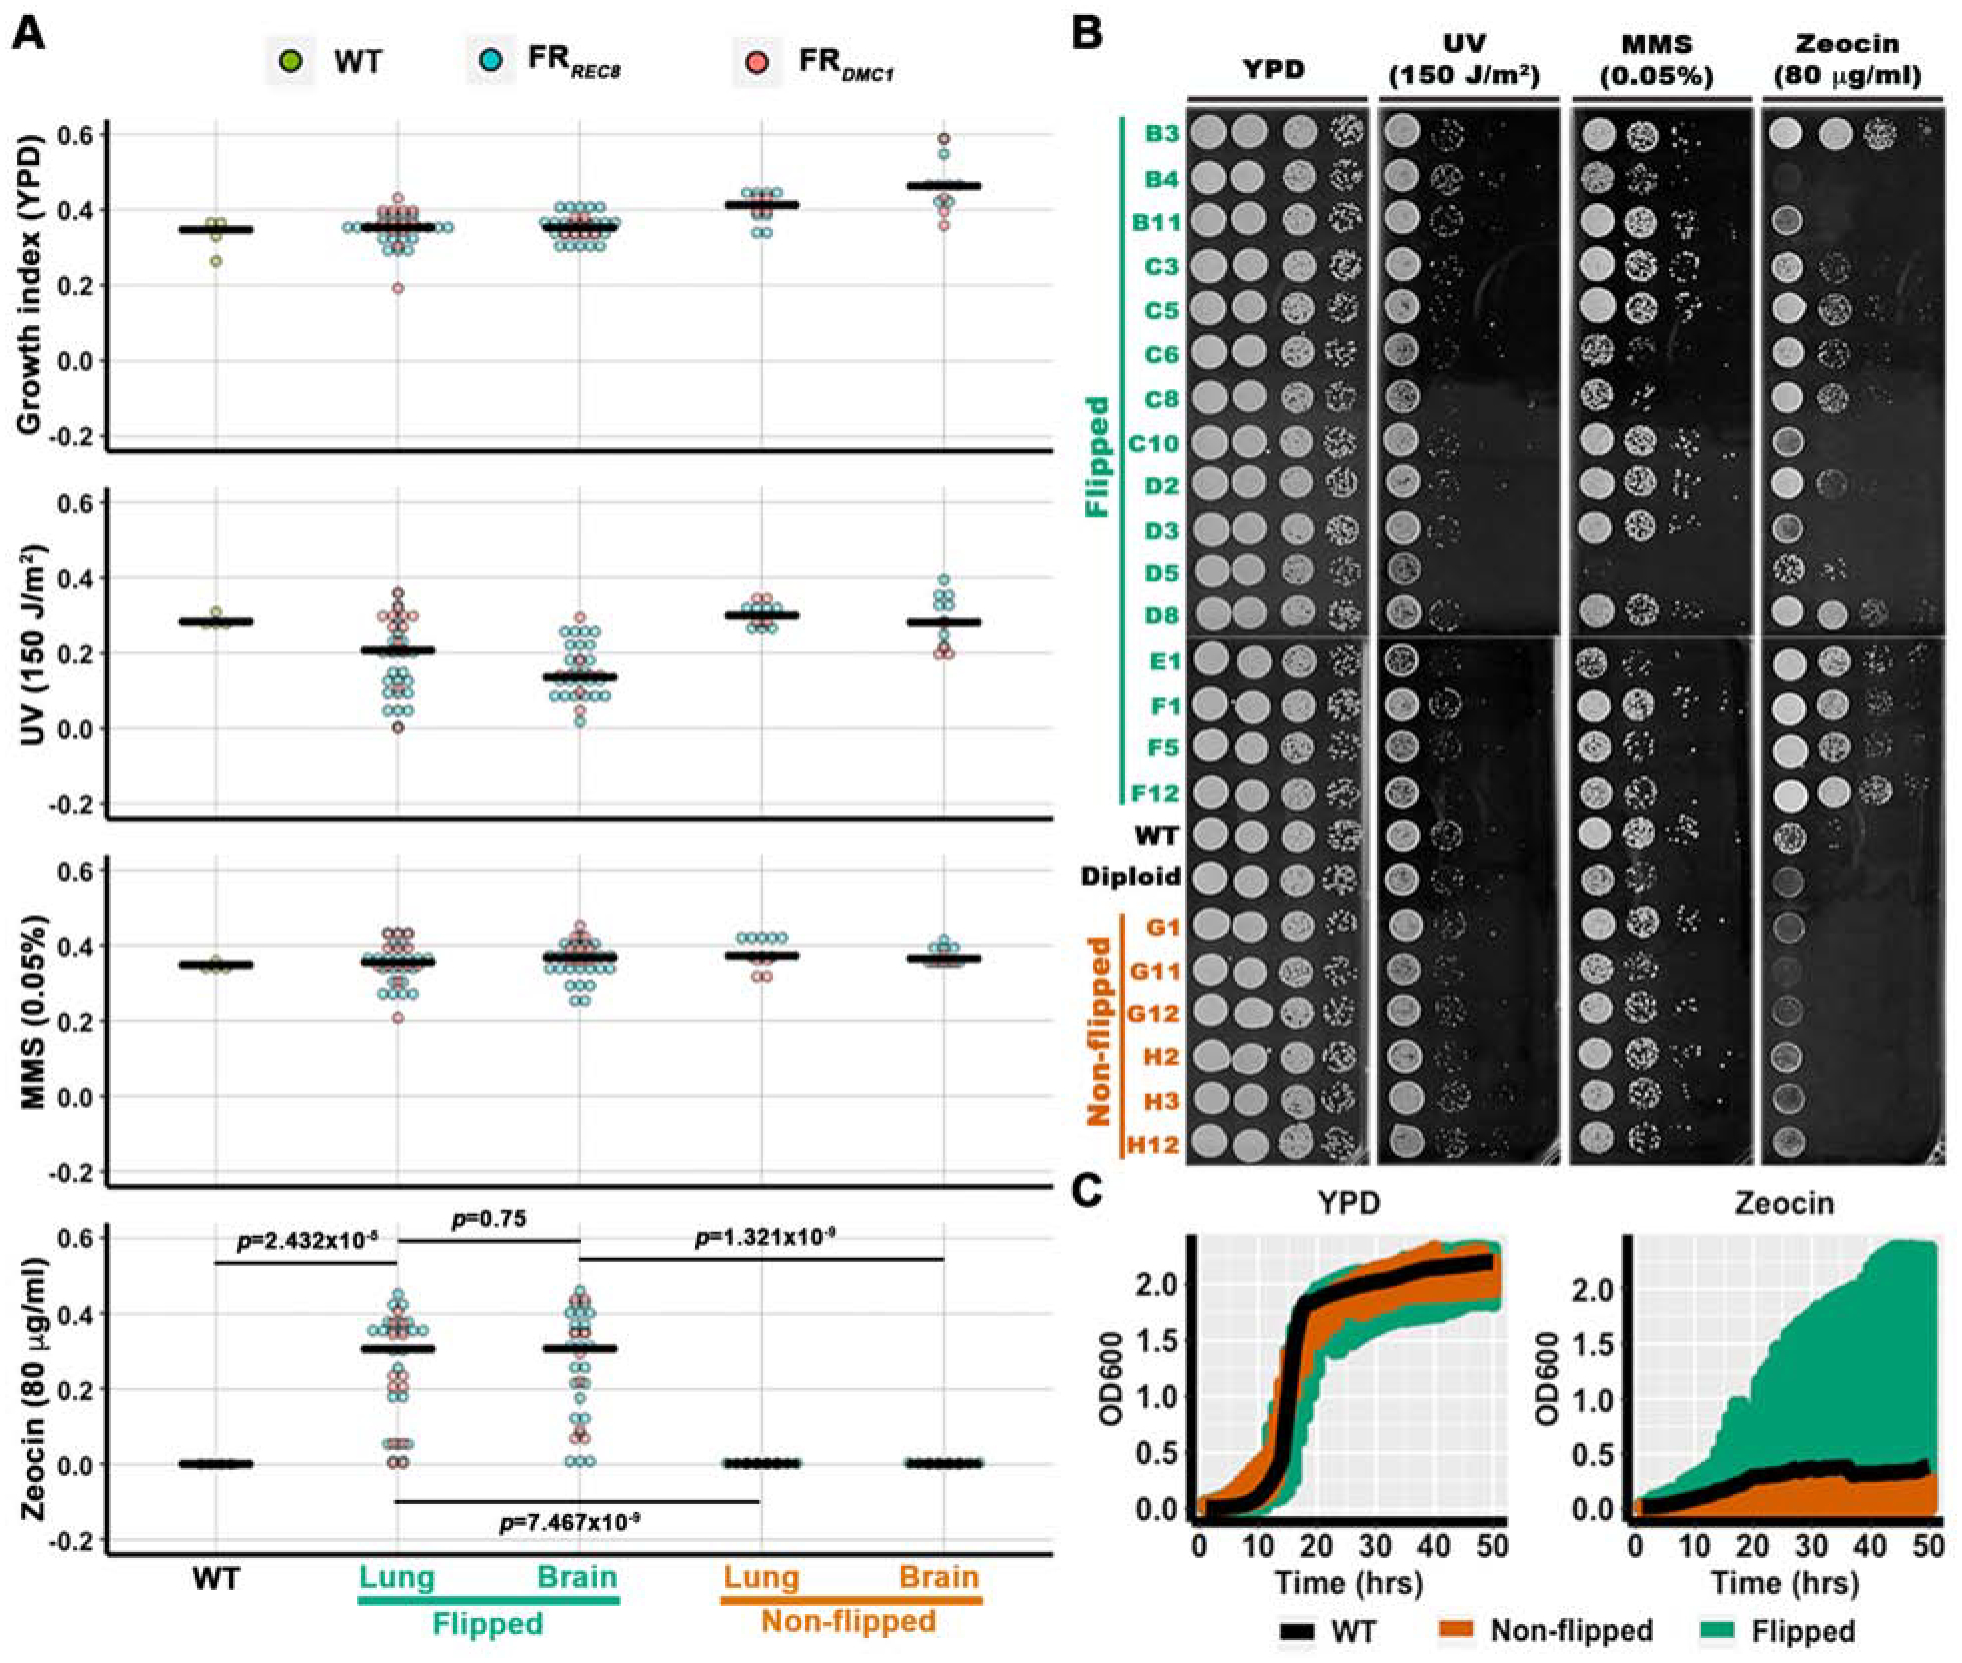
Figure 4. Phenotypic diversity of the flipped progeny recovered from infected mice.

A, A quantitative representation of phenotypic assays of the flipped and the non-flipped progeny recovered from animal lungs and brains after animals were euthanized at DPI 13. Cells were diluted into OD600=0.03 and spotted onto YPD agar media in a 96-spot format with the indicated stress factors at the indicated concentrations. Images were taken after four days of incubation at 30°C and analyzed using Colonyzer [51]. The median growth index values are shown as black bars. See Figure S4 and Table S1&S2 for the raw resource images, data, and the strain list. Mann-Whitney test was used to analyze the growth difference between WT, the flipped, and the non-flipped strains under zeocin condition. The p values of the pairwise comparisons were shown. B, Serial dilutions of the selected flipped and non-flipped progeny were spotted onto YPD agar media supplemented with the indicated stress factors at the indicated doses. Cells were then incubated at 30°C for four days. The parental haploid H99 strain and a diploid strain (H99α/H99α) served as controls. The strain labels correspond to their plate positions in Figure S4B. C, A time course growth assay of the flipped, non-flipped, and WT strains cultured in liquid YPD with or without zeocin. The overnight cultures of the strains used in panel B were diluted into OD=0.05 and inoculated into liquid YPD or YPD with 10 μg/ml of zeocin in a 48-well plate. The plates were cultured at 30°C with continuous shaking and growth was monitored by measuring OD600 every hour. The growth of the WT, the non-flipped, and the flipped strains based on OD600 measurement was plotted against the time after inoculation (growth curve assay). The colored range shows the distribution of growth curves of the WT (black), the non-flipped (orange), and the flipped (green) strains. See also Figure S4.
