
Figure 3. Endogenous PBX2 expression during ATRA treatment.
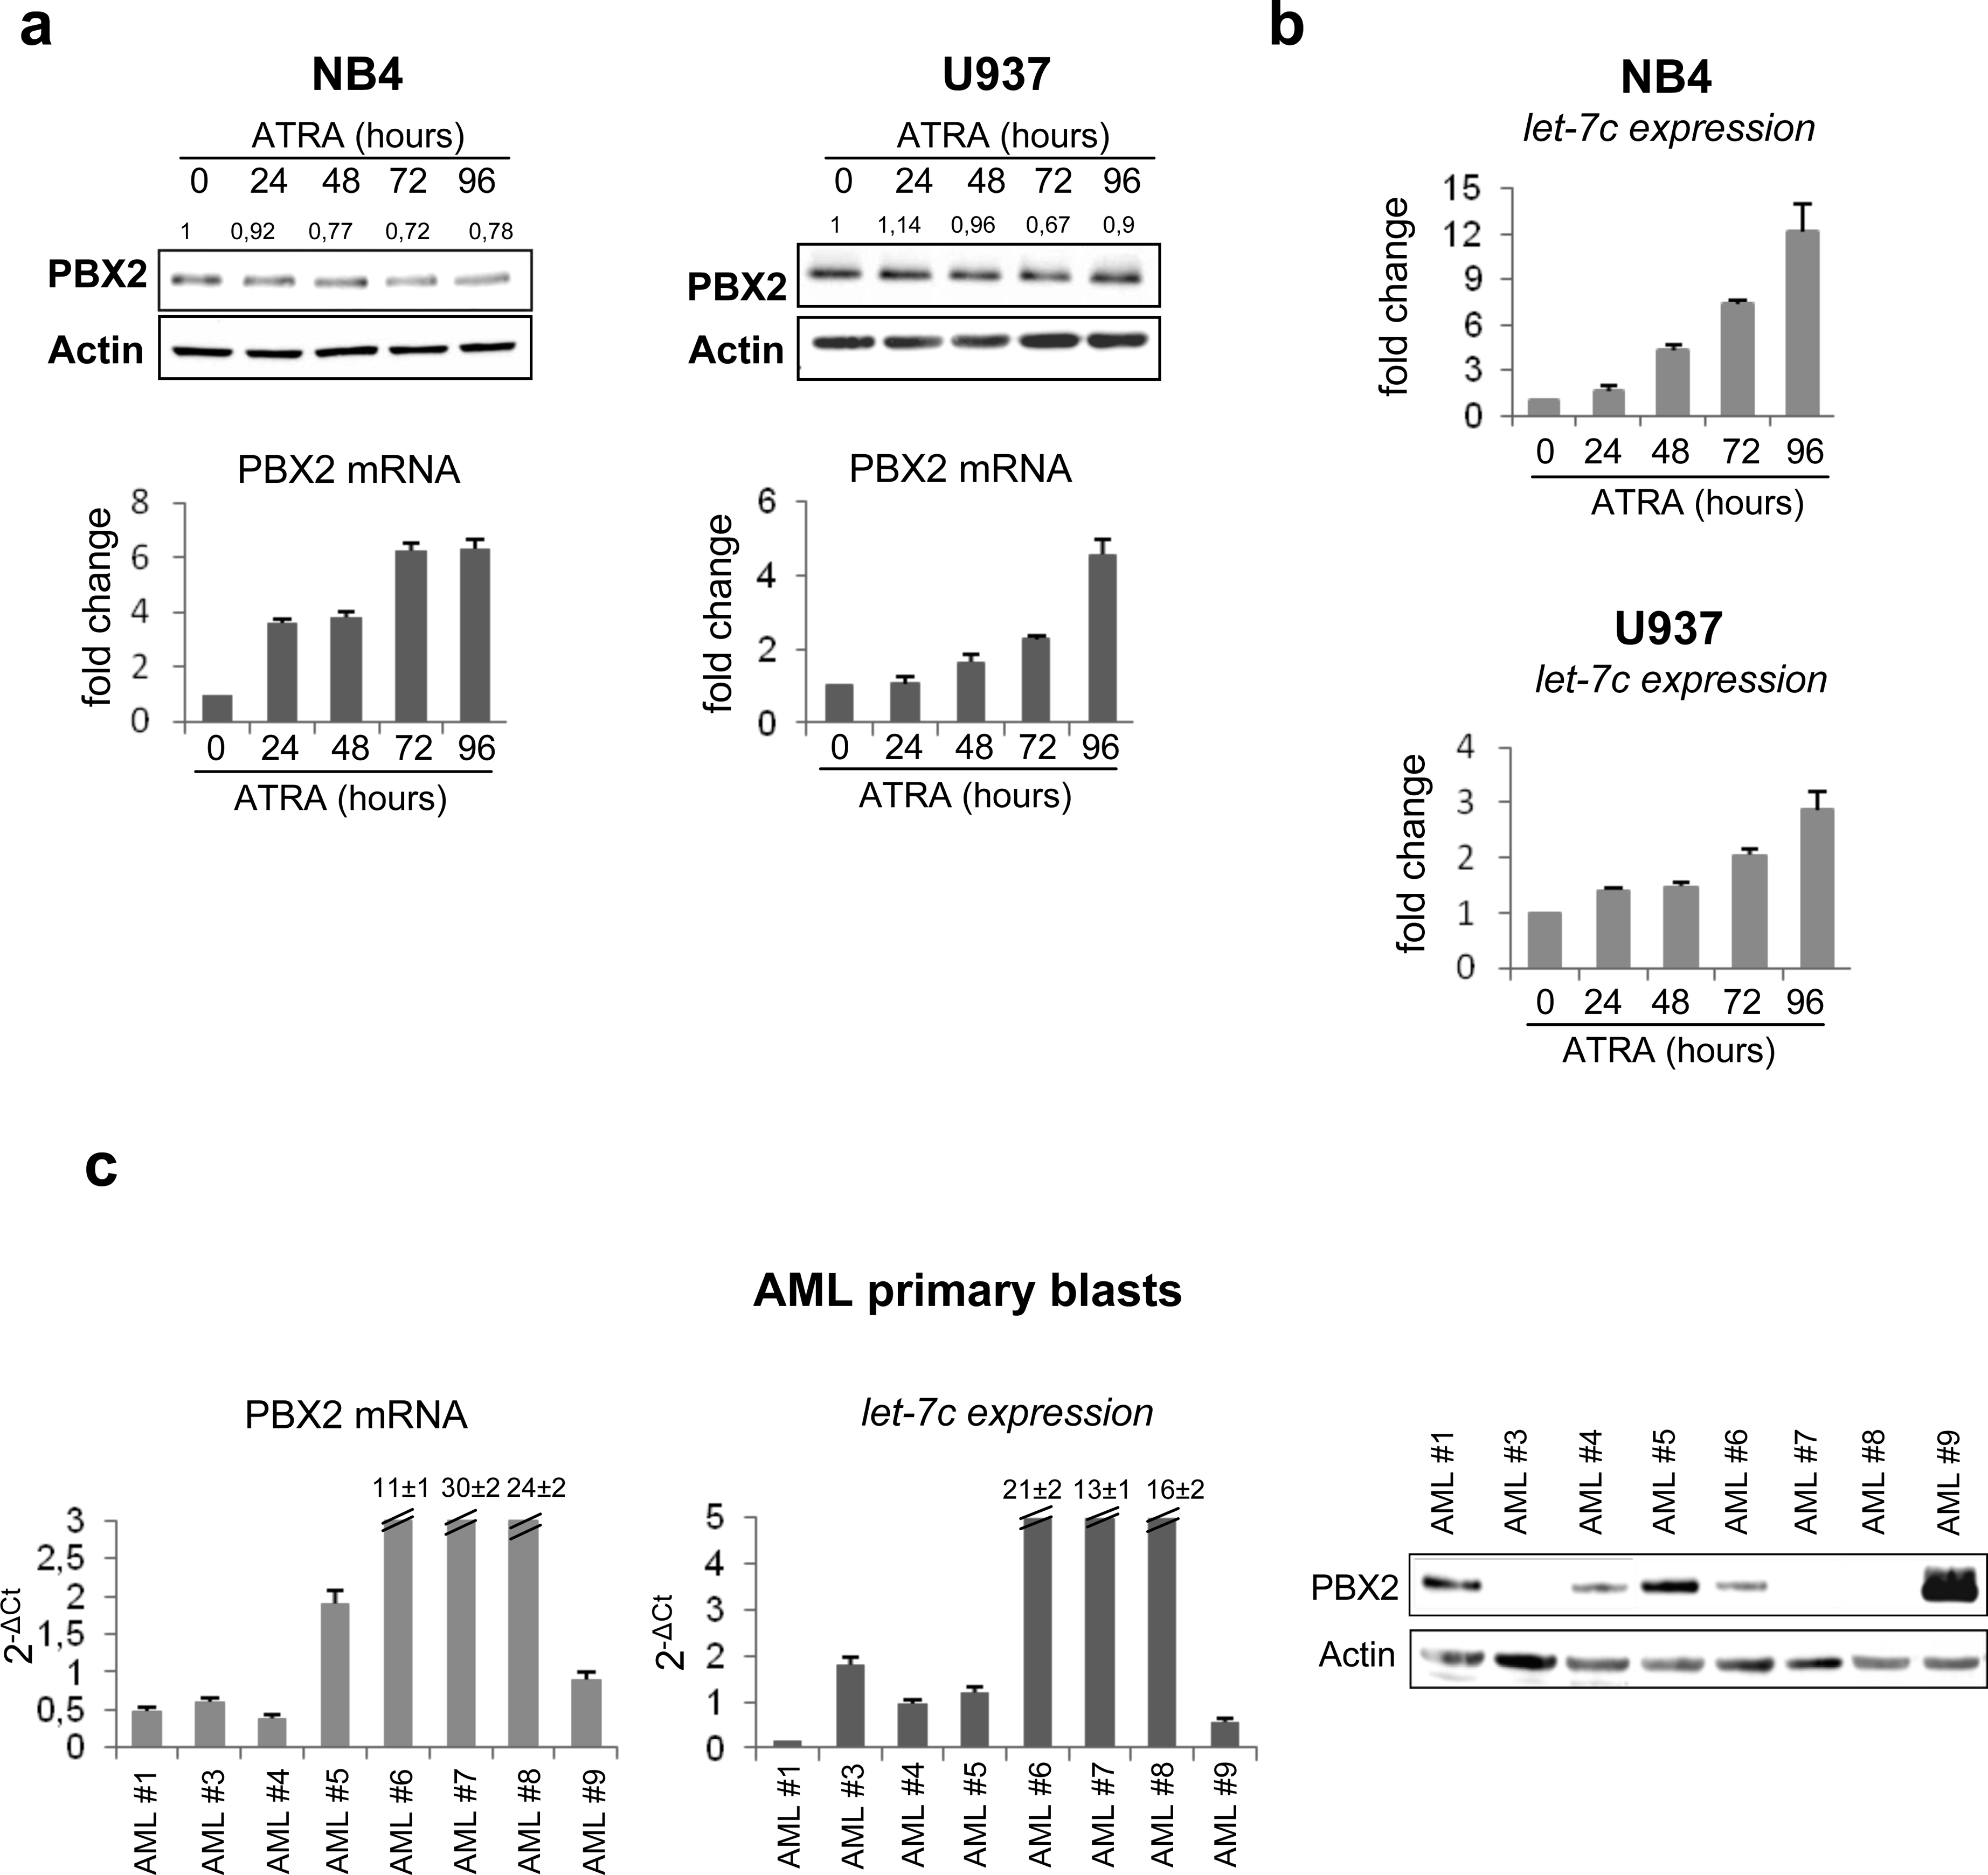
(a) (upper panel) Western blot of endogenous PBX2 protein in NB4 and U937 cells during ATRA treatment. Numbers above the lanes represent densitometric analysis of PBX2/Actin reported as fold change with respect to untreated samples. Immunoblotting and densitometry were performed as described in the legend of Figure 2b.
(lower panel) PBX2 RNA quantification in NB4 and U937 cells, during ATRA treatment, was performed using SYBR Green-based qRT-PCR as described.6 GAPDH gene expression was used as endogenous control. Results (mean ± SEM of three independent experiments) are expressed as fold changes in ATRA-treated relative to untreated cells.
(b) Let-7c expression as evaluated by stem-loop PCR in NB4 and U937 cell lines during ATRA treatment (1μM). Values are reported as fold changes compared to let-7c level in untreated cells. Error bars indicate SEM (n = 3).
(c) (left panel) RNA quantification of PBX2 by SYBR Green DNA Master mix and specific primers, available upon request, in AML primary blasts. Values are reported as 2−ΔCt. Samples were normalized to GAPDH gene expression. Error bars indicate SEM (n=3).
(middle panel) Let-7c expression evaluated by stem-loop PCR in AML primary blasts. Values are reported as 2−ΔCt. Samples were normalized to RNU19 small RNA levels. Error bars indicate SEM (n=3).
(right panel) Western Blot of endogenous PBX2 protein in AML primary blasts. RNA extraction, RT-PCR reactions, mature miRNA quantification and western blots were performed as described in the legend of Figure 1a and 2b.