
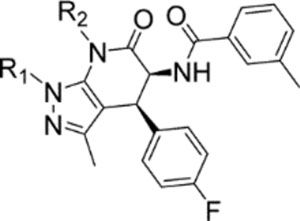
Table 3. Kinetic solubility, microsomal stability, and cell proliferation effects in normal BJ fibroblasts and malignant HCC95 cells.
Values for the proliferation, half-life, clearance and solubility are represented as means plus or minus standard deviation calculated from at least one independent experiment, run in triplicate. ND indicates values were not determined.
| No | Structure | Proliferation EC50 (μM) | T(1/2)/hr (mouse) | CLint’ (ml/min/kg) (mouse) | Avg. Sol. (μM) (Kinetic) | ||
|---|---|---|---|---|---|---|---|
| R1 | R2 | (Normal Fibroblasts - BJ) | (HCC 95) | ||||
 |
|||||||
| 3 |  |
H | > 25 | > 25 | 1.1 ± 0.1 | 50.3 ± 5.0 | 5.5 ± 1.0 |
| 27 |  |
 |
> 25 | > 25 | 1.2 ± 0.1 | 44.9 ± 3.7 | 16.6 ± 0.6 |
| 65 |  |
H | > 25 | > 25 | 0.6 ± 0.1 | 89.7 ± 4.7 | 92.8 ± 2.7 |
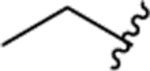
| 31 | 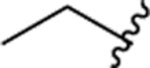 |
> 25 | > 25 | <0.1 | - | 10.9 ± 4.3 | |
| 24 | 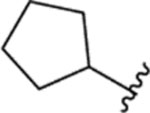 |
H | > 25 | > 25 | 0.5 ±0.1 | 116.4 ± 10.7 | 17.1 ±1.4 |
| 35 | 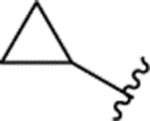 |
 |
> 25 | > 25 | <0.1 | - | 46.1 ± 3.6 |
| 123 | 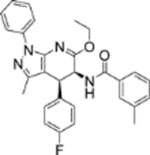 |
> 25 | > 25 | ND | ND | ND | |
| 1 | 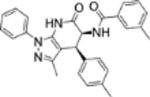 |
> 25 | > 25 | 0.3 ± 0.1 | 160.4 ± 5.0 | 1.1 ± 1.0 | |
| 87 | 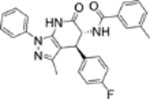 |
> 25 | > 25 | ND | ND | ND | |
| 141 | 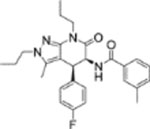 |
> 25 | > 25 | ND | ND | ND | |