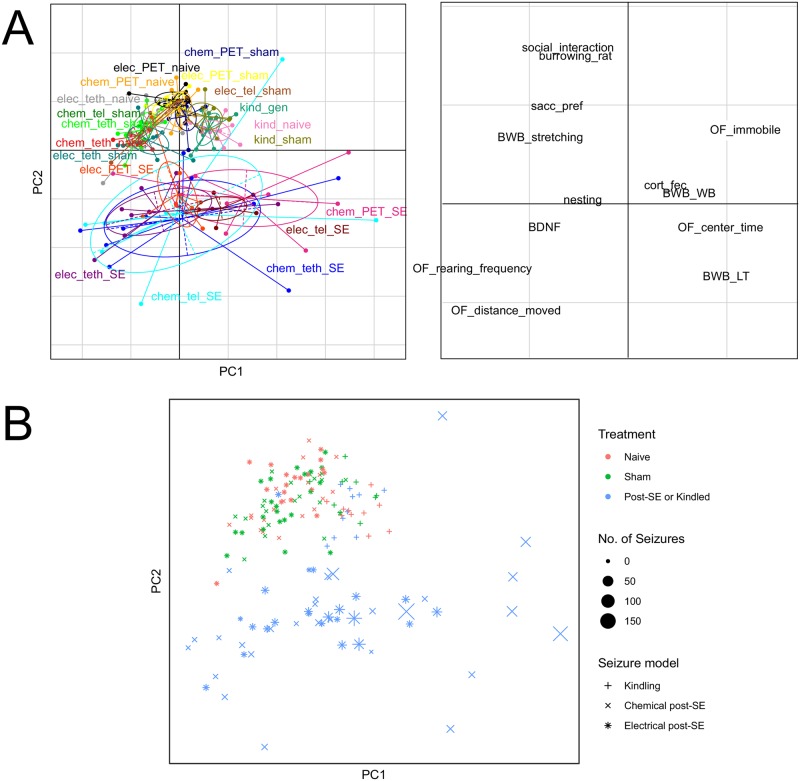
Fig 3. Principal component analysis of selected parameters.
A principal component analysis was performed 100 times using a resampled random subset of 80% of the total data. Overall runs PC2 was consistently able to separate the treatment groups on the basis of four parameters: saccharin preference, burrowing behavior, time spent in social interaction and distance moved in the open field. (A) One representative visualization of the principal component analysis. (B) Scatter plot of individual animals and their associated treatment group along PC1 and PC2, the size of the point indicates the number of seizures observed during a two-week monitoring phase.

