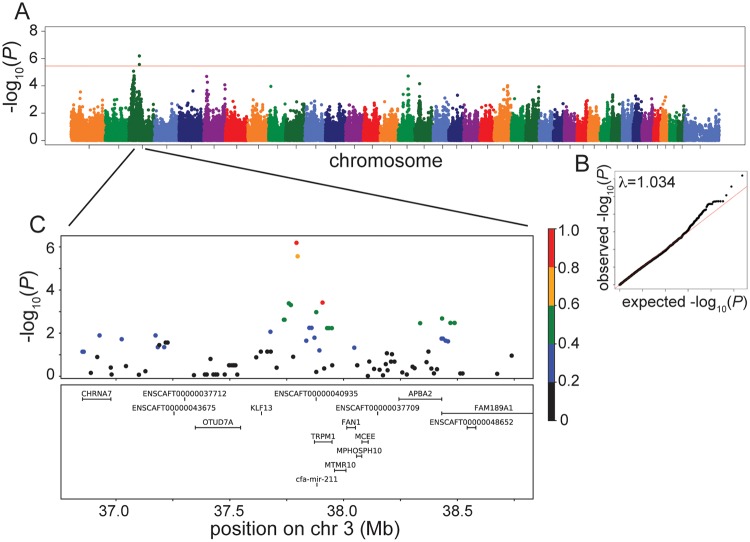
Fig 2. Manhattan, QQ and LD plots of the significant association using bilaterally deaf vs. control Australian cattle dogs.
(A) Manhattan plot. Red line shows the Bonferroni correction P-value threshold calculated on unlinked SNPs. The permutation threshold is beyond the y axis, at 1.5x10⁻⁹. (B) QQ plot with inflation factor (λ) shown. (C) LD plot zoomed in on the region surrounding the significant association. Colors indicate the amount of LD with the most associated SNP, ranging from red (r2>0.8) to black (r2<0.2).

