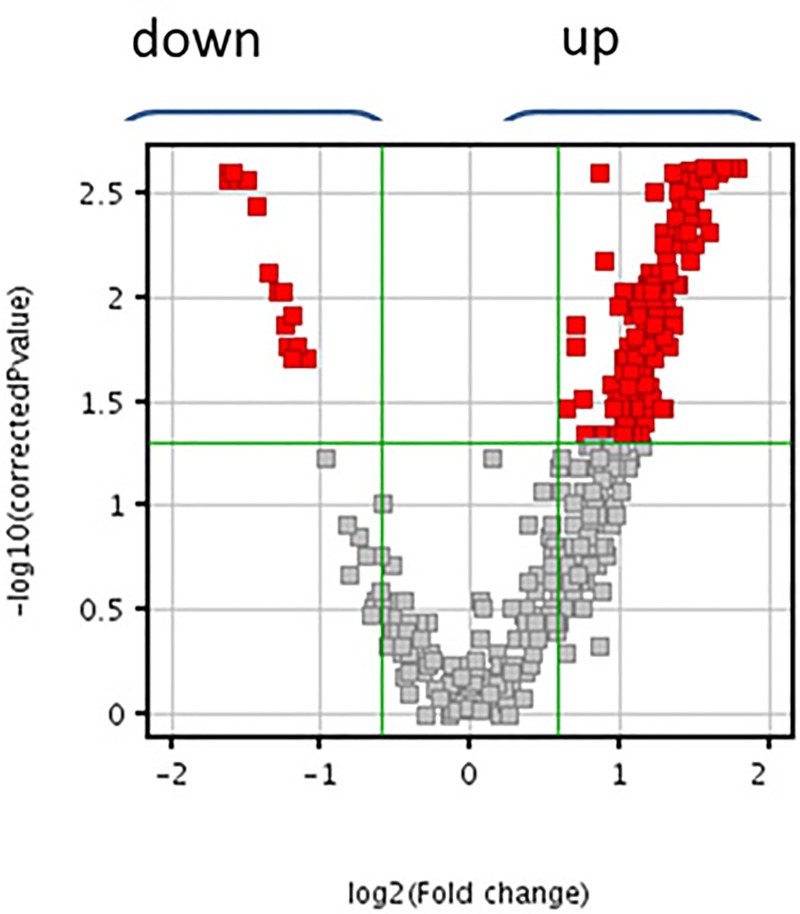
Fig 1. Volcano plot analysis of 437 compounds on negative ion scan, in Xf+ and Xf- samples.
The x-axis shows the fold change to indicate the variation in abundance of compounds present in Xf+ compared to Xf- samples. The compounds on the right side were more abundant, whereas those on the left side were less abundant in Xf+ condition. Entities that satisfied the fold change and the P-value cut-off of 2.0 and 0.05, respectively, are marked in red.

