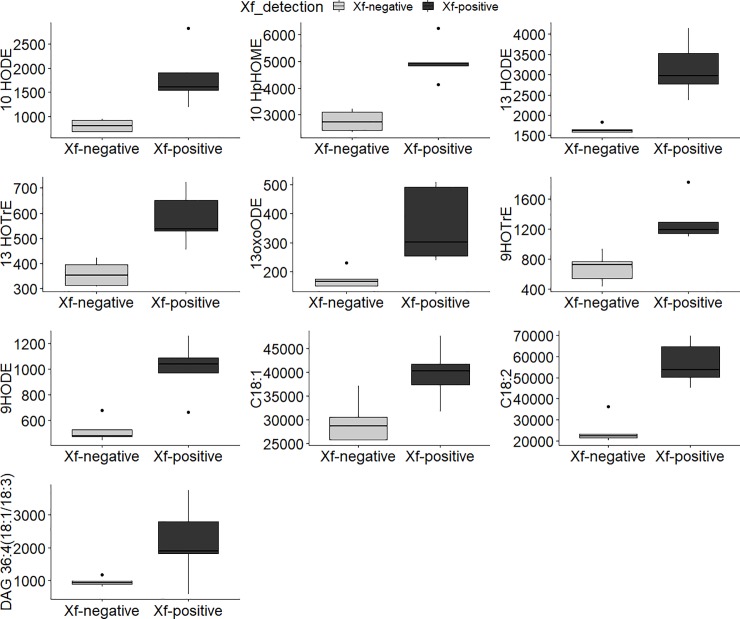
Fig 3. Boxplots of statistically significant compounds analyzed by MRM or SIM.
Comparisons between naturally non-infected (Xf negative) and naturally infected (Xf positive) plant samples are displayed on X-axis. The Y-axis shows the normalized relative abundance. Horizontal line in each boxplot indicates the median and black dots represent the outlier samples.

