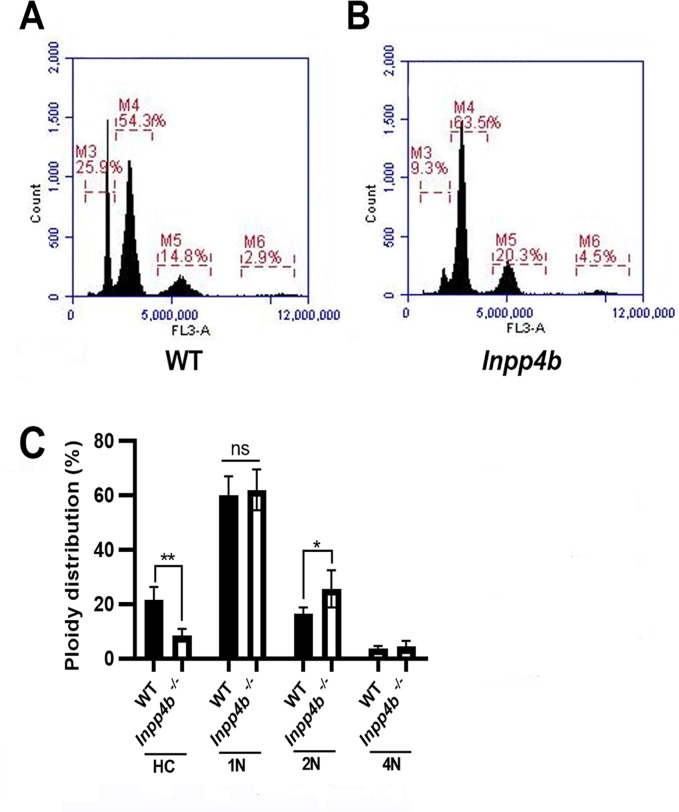
Fig 4. Flow cytometry analysis of testes from WT and Inpp4b-/- mice.
Flow cytometry histograms of A) wild type B) Inpp4b-/- testes. Testicular cells have four cell populations distinguished by DNA intensity on the Y axis: M3 (1N, haploid, elongated spermatids), M4 (1N, haploid, round spermatids), M5 (2N, diploid), and M6 (4N, quadriploid). A representative histogram from a 6-month old male in each group is shown. C) Quantitative analysis of cell populations, n = 4/group (*p<0.05, **p<0.01). Data shown as mean ± SEM. Statistical analysis was performed using 2-way ANOVA.

