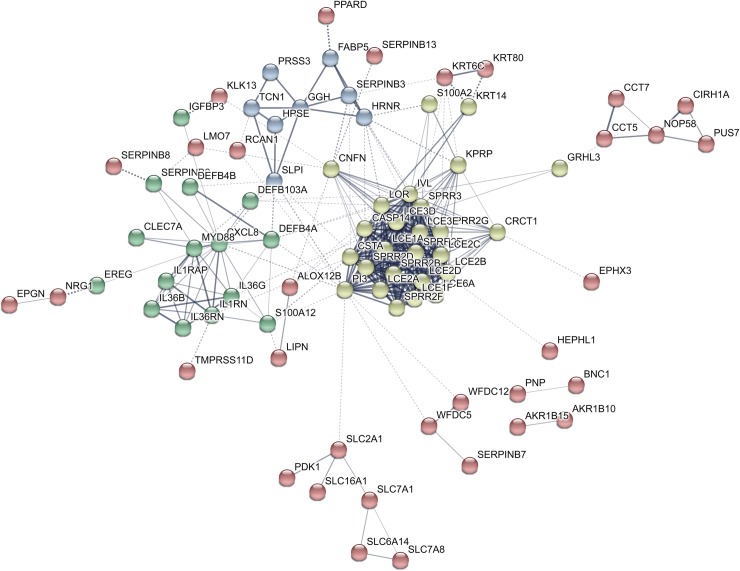
Fig 2. Constructed protein-protein interaction network of 114 downregulated genes in post-treatment versus pre-treatment actinic keratosis samples.
Nodes represent proteins and different line intensities denote the type of evidence for the interaction. Statistical analysis results for the network: number of nodes: 114, number of edges: 355; average node degree: 6.23; average local clustering coefficient: 0.48; expected number of edges: 35; PPI enrichment p-value < 1E-16.

