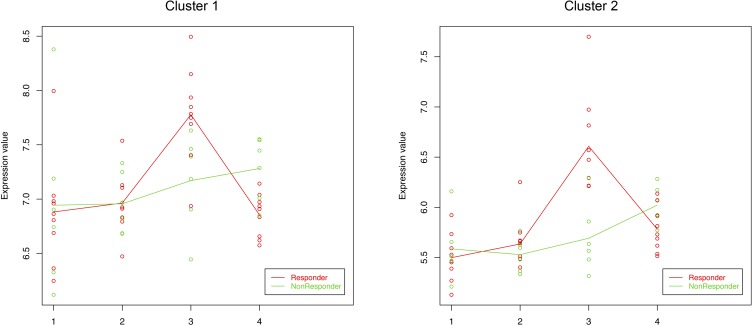
Fig 5. Cluster analysis.
Each plot shows the average expression profile of all genes in the cluster by condition. The expression values of the clustered genes are represented in red for responder patients and in green for non-responders. Solid lines indicate the average value of gene expression at each condition for each group (responders and non-responders). 1: non-lesional non-sun-exposed skin samples; 2: sun-exposed peri-lesional skin samples; 3: pre-treatment actinic keratosis samples; 4: post-treatment actinic keratosis samples.

