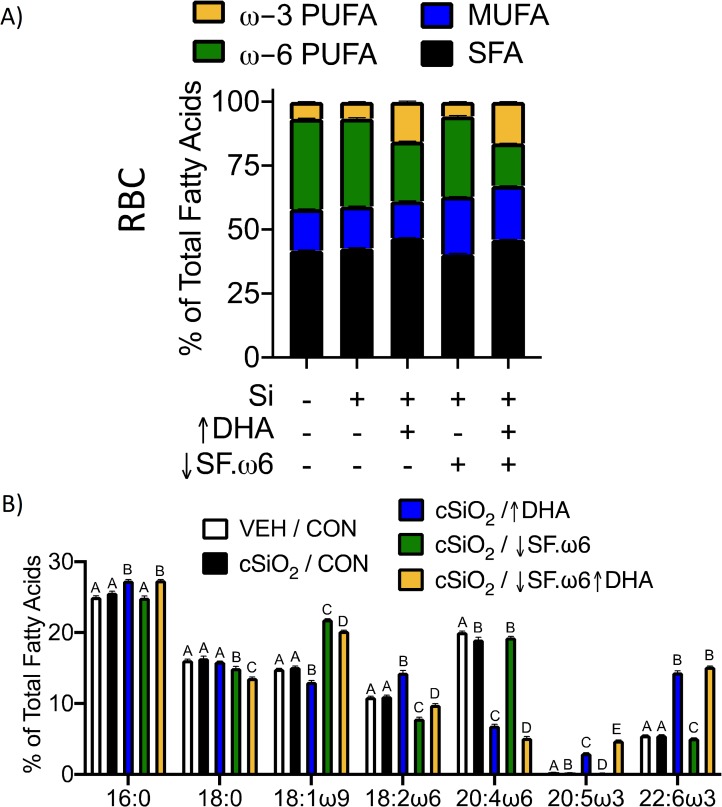
Fig 4. RBC fatty acid composition is influenced by modulation of dietary lipids.
Major fatty acid subtypes (A) and the 7 most abundant fatty acids (B) were compared across treatment groups. Total fatty was determined by GLC and expressed as percent of total. Statistically significant differences in PUFA, MUFA, and SFA are indicated in Table 3. Different letters indicate statistically significant differences between treatment groups for individual fatty acids (p<0.05).

