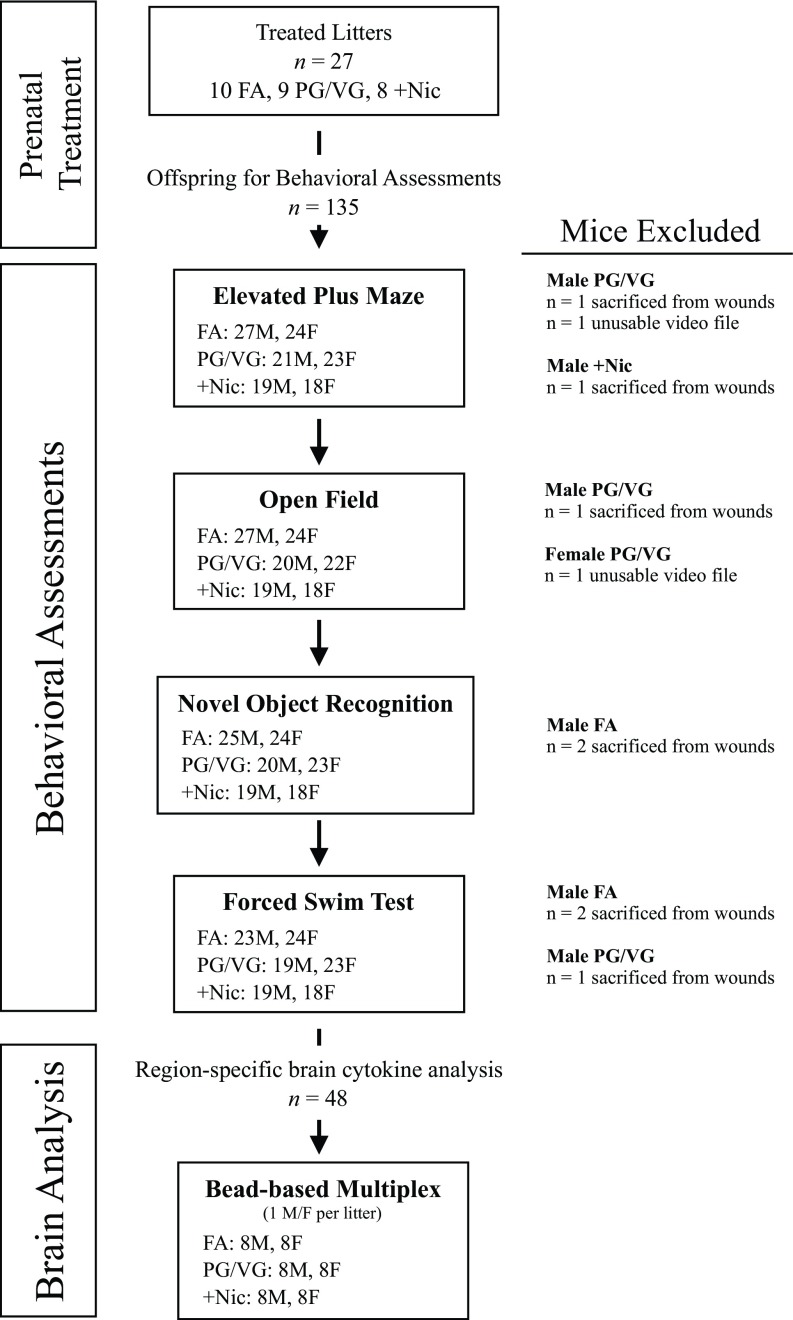
Figure 1.
Diagram of experimental procedures and sample size. The number of male and female mice in each treatment group is included for each behavioral task. Brains from a subset of mice were used for region-specific brain cytokine measures. Note: F, female; FA, filtered air; M, male; PG/VG, propylene glycol/vegetable glycerin; , propylene glycol/vegetable glycerin plus nicotine.

