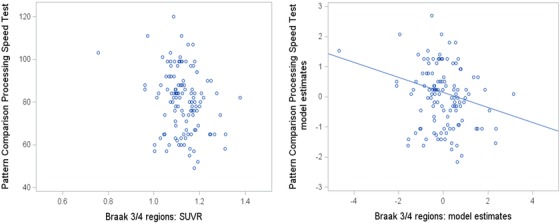
FIGURE 1.

Association between Braak region 3/4 tau (AV‐1451 retention) and Pattern Comparison Processing Speed Test performance. Scatterplot on the left shows raw data points. Scatterplot on the right shows standardized model estimates with age, sex, education, and race as covariates
